Aggregate wage-rate data show no sign of the huge and prolonged demand shock said to have hit the economy in 2008. Instead, they bear the fingerprints of an expanded social-safety net.
A conventional narrative of the American labor market since 2007 is that the demand for labor collapsed, so that despite a uniformly willing and eager work force, millions of people had to go without jobs. This narrative is an aggregate theory and not primarily about sectoral shifts that would depress demand for some types of labor and increase it for others. If this narrative is accurate, it should be visible in aggregate wage-rate data.
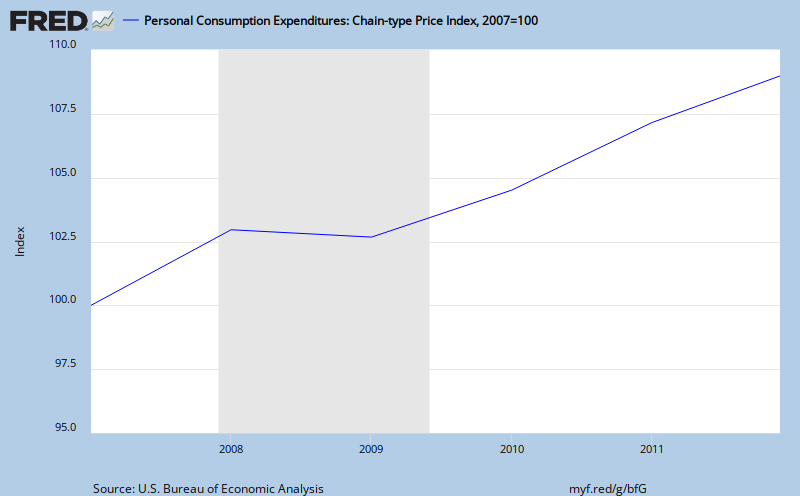
At a minimum, the aggregate demand collapse should have frozen wage rates in dollar terms, so that inflation-adjusted wages would erode with inflation as consumer prices crept up. With the price index for consumer items 8 percent higher at the end of 2011 than it was when the recession began, inflation-adjusted hourly wages should have fallen at least 8 percent over that time frame, if not more.
In my view, the change in aggregate demand has been heavily exaggerated, and the greater impulse affecting the labor market over the last five years has been higher marginal tax rates created by an expanding social safety net of unemployment insurance, food stamps, Medicare and other anti-poverty programs. Those tax rates, as I noted last week, refer “to the extra taxes paid, and subsidies forgone, as a result of working, expressed as a ratio to the income from working.”
I expected real wage rates (and hourly labor productivity) to rise in the short term, and to do so a couple of percentage points above the previous upward trend made possible by continuing progress of the productivity of labor and capital.
Marginal tax rates increase real wage rates a few percentage points in the short term because, with more help during unemployment, employees at struggling businesses have less reason to make some of the concessions in wages and working conditions that can help the employer to retain employees affordably.
As I explain in “The Redistribution Recession,” wage rates would quickly fall back toward the trend line when some of the temporary safety-net measures began to expire, which was two or three years after the recession began.
Those safety-net expansions that were permanent would eventually reduce average real wage rates, as people out of work reduced their human capital investment. This reduction might reflect people who, because they no longer practice a trade, lose contacts in the workplace or no longer maintain a wardrobe or tools they need for work. (For more on this effect, see especially the literature on women’s wage trends.) Unfortunately, these wage reductions do not encourage employers to hire because they derive from reductions in productivity.
The black series in Chart 1 below shows aggregate real wage rates measured as inflation-adjusted employee compensation (including fringe benefits like health insurance) per hour worked. I have removed an upward trend, because for short-run analysis it is interesting to look at deviations from trends. Under normal conditions real wages can increase with productivity even while the amount of labor is neither rising nor falling.
 The trend adjustment is 0.5 percent a year, based on the average rate of growth of total factor productivity during the four years before the recession. Without the trend adjustment, the black series would increase two percentage points more through 2011 than shown.
The chart also shows in red the marginal tax rate on labor income measured in my book for a typical household head or spouse based on the ever-changing eligibility and benefit rules for safety-net programs. Sure enough, real hourly compensation increased during the recession and did so about a quarter after marginal tax rates began their increase.
Marginal tax rates were high and fairly flat during 2009 and early 2010 as the “stimulus” law was in full force. During this time, real wages failed to fall back anywhere close to their prerecession values. Only when some of the stimulus provisions began to expire, reflected in a marginal tax rate that falls to 44 or 45 percent from 48 percent, did real wage rates decline quickly and significantly.
Even after the decline in late 2010 and early 2011, it looks as though real wage rates are about where the previous trend line was, rather than being the several percentage points below what one might expect after a huge, prolonged demand shock.
A few economists have used Census Bureau wage data, which ignore the fringe benefits from employment, to show that wages fell during 2010 and 2011. It is incorrect to ignore fringe benefits (I discuss this and other wage measurement issues in Chapter 2 of “The Redistribution Recession”), but the choice of series is just a quibble, because none of the aggregate wage measures display a cumulative decline that would be commensurate with the huge, prolonged demand collapse said to have occurred.
A magnifying glass is not required to see a decline in after-tax real wage rates. The after-tax real wage rate (calculated as the product of real hourly compensation and one minus the marginal tax rate shown in black in Chart 2), reflects the net financial reward per hour of working, taking into account taxes and safety-net subsidies.
 The after-tax real wage series has been adjusted for a trend of 0.5 percent a year.
Marginal tax-rate changes, such as those created by an expanding social safety net, cause deviations between the real hourly compensation shown in Chart 1 and the after-tax series shown in Chart 2. In theory, the downward marginal tax rate effect on after-tax real wages exceeds the upward effect on real hourly compensation.
In fact, after-tax real wages fell a startling 12 percent below the trend line during the first two years of the recession (note that each tick in Chart 2 is twice as large as each tick in Chart 1). They rebounded somewhat as marginal tax rates came off their stimulus highs but still remain six or seven percentage points below the trend line.
The quantity of labor — hours worked per capita including zeros for people not working – is shown as a red series in Chart 2. Remarkably, labor and after-tax real wage rates collapse together, hit bottom together and exhibit a partial recovery together.
Helping the poor and unemployed is intrinsically valuable, but is not free. It has made labor more expensive and depresses employment.


1 comment:
Very nice article about wall street. I also think that de stock market will going down.i date asia
Post a Comment