Showing posts with label anti-poverty programs. Show all posts

Saturday, November 13, 2021

Social Justice Thrives in Cook County during Tradeoff Holiday

During this terrible pandemic, a silver lining has been that many inconvenient tradeoffs no longer apply. A Yale study showed that paying people not to work does not, for the time being, prevent anyone from working. Perhaps also emptying the prisons can enhance public safety. We can have social justice and safety at the same time.

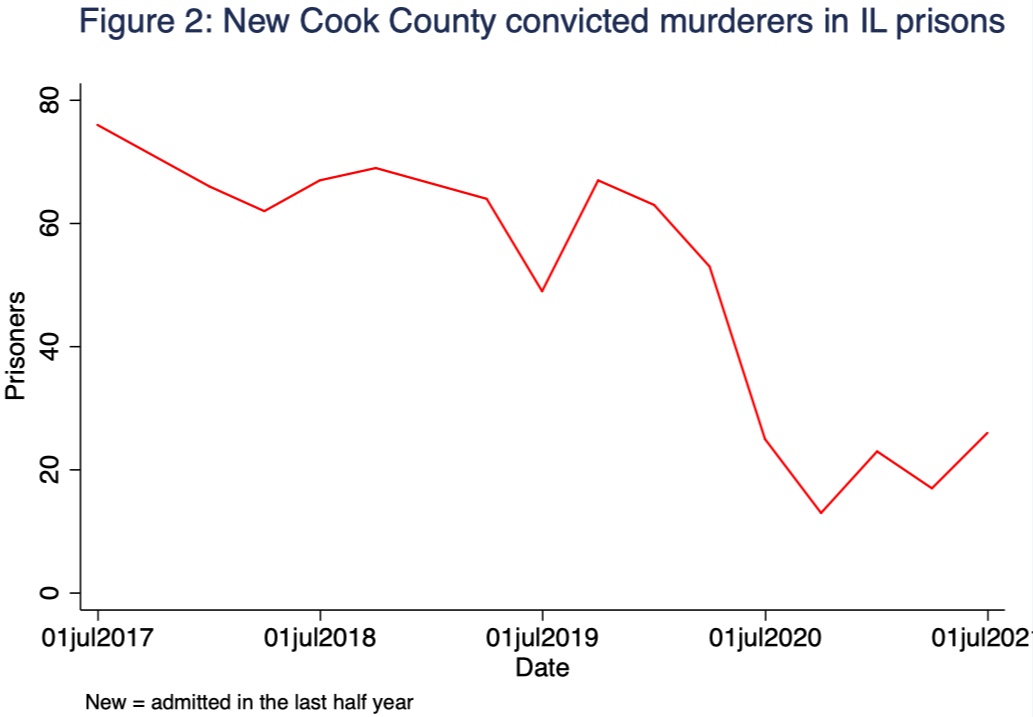
Figure 1 below shows points-in-time numbers of people in Illinois prisons who were convicted in Cook County and admitted to prison within the past half year. The stock of new convicts had been between 3000 and 4000, until the pandemic when it dropped to 1000. Figure 2 limits the sample to convicted murderers. They had been entering Illinois prisons at a rate of about 130 per year (65 per half year), until the first half of 2020 when the rate dropped to about 40 per year (20 per half year).


I hope that Chicago-area activists can work to help maintain this progress. Perhaps they could even lend some expertise to the rest of Illinois (not shown in the charts above), which has missed a social-justice opportunity by continuing to admit convicted murderers to prison at pre-pandemic rates.

Formerly experts thought that incarceration enhanced public safety.  But that was based on old data, examined by researchers lacking sufficient social-justice training.  Especially during a pandemic, there is no reason to worry about adverse consequences until somebody has conducted a new study using state-of-the-art empirical methods.

A troublesome skeptic might insist on metrics to indicate when the tradeoff-holiday has ended, when the path to safety might again involve more incarceration rather than less. Could it be dangerous to barrel forward on the social-justice highway, when at any moment we could find ourselves in high-speed reverse?

Such a reactionary critic forgets that social justice is crowd sourced. The overwhelming odds are that one of us will notice the situational shift and promptly alert the polity. In the worst-case scenario, remember: if we want to make an omelette, we must be prepared to break a few eggs.

[Update: Cook County Prosecutor Kim Foxx is often credited with reducing incarceration.  This week the American Constitution Society and the Black Law Students Association of UChicago Law School hosted her.  Did you encourage her to keep making the omelette?!]

Thursday, November 4, 2021

3rd release of Build Back Better: 7 million less employment

Last night a third release of BBB was shown to the public.  Both in pages and overall economics, it is in between the 1st and 2nd editions.

First-release items resurrected yesterday

  • Repeal of Trump's terrible rebate rule (Section 139301).  It is likely illegal so repealing it does nothing but CBO probably will credit Dems with cutting about spending by about $200B with this provision.
  • Drug "Price Negotiation Program" (Section 139001).
  • Rx "Drug Inflation Rebates" (Section 139101).
  • Favors to labor unions such as allowing union dues to be tax deductible (Section 138514) and giving the National Labor Relations Board new authority to levy hefty penalties on employers (Section 21006, which was also in previous releases).  
  • E-cigarette and tobacco taxes (Section 138520).
  • Federal family leave (Section 130001).
Important items maintained from the 2nd release
  • Affordable housing (still $150B across various sections such as 40001ff).
  • Expanded ACA premium tax credits (Sections 137301ff).
  • New federal childcare (Section 23001) and preK programs (Section 23002), including massive hidden taxes on marriage.
  • Child Tax Credit expansion (Section 137101ff).
  • Partial launch of the Green New Deal (various sections such as 136001ff).
  • Medicaid expansions (various sections).
  • Privacy regulation (Section 31501).
New item: Increase annual cap for deduction of State and Local Taxes (SALT) from $10K to $72.5K (Section 137601).  About 8 percent of filers are affected by this.  I guess that about 6 percent of filers are workers who would go from a binding cap to a nonbinding cap.   For such people, IF the federal and SALT rates remain constant, the overall marginal tax rate on labor income falls.  This is my assumption for the table below, but I note that lifting the SALT cap encourages states to increase SALT rates (for everyone, not just the 8 percent) and discourages states from cutting rates.  Moreover, the additional SALT revenues from those rate changes may well be spent on programs that pay people not to work.

This table shows 14 BBB provisions with significant hidden effects on incentives to work.  (My earlier post provides more detail on those incentives).  The final column of the table shows an estimated impact of these hidden incentives on FTE employment, allocated among the 14 provisions.  This does not include any employment effects of funding BBB with income taxes on households (Sections 138201ff) and businesses (Sections 138101ff).


Thursday, October 14, 2021

Childcare in "Build Back Better"

Because childcare is said to be a highlight of the “Build Back Better” bill, I read through the bill and made notes here as to childcare provisions and some of their economic incentives, aside from the obvious that new spending must someday be financed with taxes.  You will be surprised at the disparity between what the bill incentivizes and what we're told it will do.

[For provisions less related to childcare, see my earlier summary.]

Section 23001 of the "Build Back Better" bill would use the Obamacare mold to create a federal childcare program.
  • Low-cost (a.k.a., "low quality") childcare would be prohibited unless the provider were to forgo all federal dollars, which would involve something like having zero children from a family at or below $200K annual income.
    • Childcare workers would have to be paid as much as elementary-school teachers.
    • According to the Bureau of Labor Statistics, elementary school teachers earned an average of $63,930 annually in 2019.
    • The same BLS data show childcare workers earning an average of $25,510.  I.e., under BBB childcare would have to pay them 151% more.
    • A 151% increase is similar to the increase in individual health insurance premiums that occurred when Obamacare came into effect.
    • See also Section 132002f (which appears to be eliminated in the Nov 3 revision).  Complying with all of these statutes, certifications, and the implementing final rules will add administrative costs to childcare.  E.g., just as physicians today complain about paperwork taking away from their real job, so will childcare providers under BBB.
    • Much of the extant supply of childcare is provided at a church or other faith-based location, but federal funds for expanding supply cannot be used there (this prohibition is about 80% of the way through the long Section 23001).  The result will be creating supply at locations that could not otherwise pass the market test because they are too costly or offer insufficient quality (by parents' assessment).    
    • When quality regulation was tried in Quebec, the results were opposite of advertized intentions:
      • there were “increases in early childhood anxiety and aggression”
      • “there was a large, significant, negative shock to the preschool, noncognitive development and health of children exposed to the new program, with little measured impact on cognitive skills.”
      • “worse health, lower life satisfaction, and higher crime rates later in life.”
      • HT Ryan Bourne
  • Families would pay on a sliding scale.  i.e., earning more means paying more for the same childcare.
    • Above 150% median family income ($102K annually), the implicit marginal tax rate would be 7% until the benefit is exhausted.
      • For a family with two children, they would face the 7 percent rate until income was beyond $400K
    • Between 75% and 150% median, the implicit marginal tax rate is about 14 percent.
    • The sliding scale is based on HOUSEHOLD income: the implicit marriage tax could easily be $20K per year that a couple has children under age 5.  [this is not the only marriage tax in BBB]
      • The unintended (?) consequences do not stop there.  Adding to the pool of "deadbeat dads" further discourages work because of the "overhang" (an economics term) of mounting child support debt.  As a UWisconsin study put it, "greater debt has a substantial negative effect on both fathers’ formal employment and child support payments."  See also this article.  
      • For most families, the childcare costs of having additional children 0-4 would be zero.  This will affect the number and spacing of births , and by this channel could reduce employment of mothers.  Also incentives to keep cousins in the household.
  • Although there are loopholes, child eligibility requires a parent to be employed (part-time is OK), self-employed, engaged in job search, job training, school, or on medical leave.  It’s OK if a second parent does no work (but see the marriage tax above).
Section 23002 creates a universal public pre-school program
  • no tuition charged to parents
  • applies to exactly two cohorts of children (age 3 and age 4).
Section 132001: Federal funding for childcare information services (i.e., finding childcare).  Less than 1/1000th of the funds spent in Sections 23001 and 23002.

Sections 137102f: Expanded Child Tax Credit (CTC).  See here for a detailed analysis of how the expansions discourage work, especially among single mothers.

Section 137201: Expanded Child and Dependent Care Tax Credit (CDCTC, not to be confused with the CTC).  This credit is tied to employment.  On the other hand, it is phaseout with income.  Therefore its net effect on national employment (not counting the tax increases that will eventually be needed to pay for it) will be less than the effects cited above.  Section 137202 is a similar provision administered on the employer side, but is not phased out with income and therefore expanding it is more likely to encourage work.  However, this provision is apparently rarely used by employers: see CBO's revenue score from the American Rescue Plan, which had the same provision except on a temporary basis.

Section 137301: a per-employee business credit of up to $5,000 annually is available for operators of childcare facilities (I don't think a household employing a nanny would count).  This might, to a small degree, offset the higher wages that such facilities would be required to pay (recall the 151% increase cited above).   [This was eliminated from later drafts]

Wednesday, October 6, 2021

Build Back Better's Hidden but Hefty Penalties on Work

Largely by stepping toward an economy in which workers bear the burden of distributing healthcare and housing with little regard to ability or willingness to pay, the Build Back Better bill (BBB) would implement the single largest permanent increase in work disincentives since the income tax came into its own during World War II.

The bill would also reduce work by limiting competition in the labor market, imposing employer mandates, and increasing consumer prices for telecommunications, energy, and other products.   All of these disincentives go on top of those already in the baseline due to a continuing portfolio of federal, state, and local tax, spending, and regulatory policies.

The implicit employment and income taxes in BBB would increase marginal tax rates on work by about 7 percentage points.  I expect that such a change in the disincentive would reduce full-time equivalent employment by about 4.5%, or about 7 million jobs. 

Penalizing Work and Hiring

The disincentives are delivered through two fundamental economic mechanisms.  First and foremost is the creation and expansion of employment-tested benefits.  Full-time employment is a major barrier to participating in the programs, even if that employment does not produce much income.  Especially, BBB allows even America’s highest-income households to participate in subsidized “Obamacare” insurance plans as long as they are not engaged in any job that offers health insurance.  For most full-time workers, their employment status by itself excludes them and their family from the additional Obamacare subsidies delivered through BBB, especially its sections 137501 and 137502.

[Some employers will respond to BBB by dropping their coverage, but from an employment-incentive perspective this only changes the form of the full-time employment tax to the Affordable Care Act’s (ACA’s) employer penalty for not offering coverage.  The salary equivalent of that penalty is almost $4,000 per full-time employee per year].

Family medical leave is another benefit tied to not working.  Section 130001 is quite explicit that eligibility requires a caregiving activity “in lieu of work, other than for monetary compensation.”   Family medical leave is a cash benefit paid in proportion to the number of hours of such caregiving.  [Presumably the beneficiary could not both engage in a normal work schedule and claim such caregiving activities, but the details would be the subject of future executive-branch rulemaking.  If double-dipping were rampant, this would raise expenditure on the program thereby requiring additional taxation that would itself discourage work.]

BBB also creates and expands employer mandates, with compliance enforced with penalties that are proportional to employment, regardless of how rich or poor the employees may be.  An example of a proportional employer-penalty scheme is BBB’s new requirement to administer IRA deductions from employee paychecks, with all employees enrolled by default.  The penalty for non-compliance is $10 per employee per day (Section 131101), which is similar in magnitude to the ACA’s penalty for failing to provide health insurance.

Section 21004 increases penalties on employers for failure to comply with federal occupational safety, health, and labor-standards requirements.  The increases are tenfold or more.  For example, the penalty for a large (100+) employer to employ an unvaccinated person is between $50,000 and $700,000 per violation and an additional $70,000 per day, all rescaled for the inflation adjustment prescribed in the statute.  This could amount to $51 million (sic) for every year that each unvaccinated person remains on the payroll.

These and other parts of BBB further reduce employment by suppressing competition in the labor market.  Such provisions seek to prevent non-union workplaces, which are almost 95 percent of all private employment, from distinguishing themselves from unionized workplaces.  Others put nonunion workplaces at an outright disadvantage.  [The labor union movement, of course, is an attempt to restrict or monopolize the supply of labor in order to extract higher employee compensation.]  Section 138514 would allow union dues to be deductible from federal income tax, putting about $400 million per year on the union side of the economic scale.  Other sections, such as 132002, target “infrastructure grants” to “labor unions and other employers … that pay the prevailing wage.”  Section 136401 creates a credit for the purchase of an electric vehicle that “satisfies the domestic assembly qualifications” (that is, unionized).


Penalizing income

The second mechanism is income-tested benefits, which discourage the earning of income by withholding benefits as a household’s income rises.  For example, Section 136407 creates a tax credit for 15 percent of the price of the purchase of an electric bicycle, but the credit is reduced $0.20 per additional dollar earned by the household.  More important, from an aggregate perspective, are the various additions to major income-tested programs such as Medicaid, “affordable housing” and the Child Tax Credit.  By my count, the various new affordable housing subsidies in BBB exceed $220 billion over ten years [two days after I wrote this, CBO estimated $312 billion].

Other provisions are, legally or economically, new excise taxes.  These discourage work by reducing real wages, especially to the extent these policies raise consumer prices by protecting incumbent producers.  A major example is section 31501, which directs the FTC to further enforce “privacy” rules that are effectively prohibitions on lower cost internet plans.  When President Trump and the 115th Congress repealed such prohibitions, the cost of internet service dropped so sharply and immediately that the consumer savings drew the attention of then Federal Reserve Chair Janet Yellen due to its visible effect on the overall Consumer Price Index.  This shows why we can expect higher prices for internet plans under BBB.

A plethora of “green policies” have a similar effect on prices of transportation and energy, such as taxes on methane emissions (Section 30114), subsidies to rural utilities (Section 12007), and green electricity programs (Sections 30411, 136101).  Undoubtably the BBB will be sold as a windfall for the poor, but all of the bill's explicit and implicit excise taxes are particularly regressive.


Projected Employment Effects

The magnitude of BBB’s disincentives for work and hiring varies across households and firms.  They also vary by margin of response, such as adjusting work schedules, the duration of employment, or the duration of nonemployment.  Properly measured disincentives also reflect the reality that benefit takeup is typically well below one hundred percent.  I estimate that, on average, BBB implicit employment and income taxes would add almost seven percentage points to the marginal tax rate on labor income.  At least another two percentage points would someday be required to finance its projected $220 billion contribution to the annual federal budget deficit.

These disincentives are on top of the many other taxes on income, payroll, and sales; other implicit and explicit employment taxes; and longstanding income-tested benefits.  Even ignoring the additional financing, the disincentives would reduce the share of marginal product kept by the average worker from about 0.52 to 0.45, which is a reduction of about 13 percent.  I expect that such a change in the disincentive would reduce full-time equivalent employment by about 4.5%, or about 7 million jobs.  Perhaps employment would prove to be more sensitive to incentives, as it did during the 1990s welfare reform (see also the update below), or less sensitive, but 7 million is a good point estimate.

I estimated the 7 percentage points by aggregating the disincentives in the various sections of BBB.  The largest is the expansion of subsidies for Obamacare exchange plans.  Using the same methods as Mulligan (2015), I estimate that these subsidies by themselves add almost three percentage points.

For the employer IRA mandate, I estimate 0.5 percentage points, which is the average result from two methods.  One method is from Council of Economic Advisers (2019) analysis of the removal of an IRA mandate.  The second method is, based on the Harberger triangle method, to take half of the penalty and apply it to the 33 percent of workers who do not currently have pension coverage through an employer.

Although the BBB’s expanded Child Tax Credit (CTC) has received much attention, I do not find that it adds much to the marginal tax rate on labor income.  The CTC expansion removes a negative tax on labor income, but that applies only below the poverty line and is offset to some degree by expansions in the Earned Income Tax Credit.  The CTC creates a new five percent phaseout range, but my estimates from the Current Population Survey suggest that less than five percent of nonelderly persons aged 21-64 are in a household that with 2019 incomes that would be in that range.  I therefore estimate the expanded CTC’s contribution to the marginal tax rate increase to be only 0.24 percentage points.

For several other provisions, such as the Medicaid expansion in states that opted out of the original ACA expansion, the new Medicaid home and community-based programs, and affordable housing, I assume that each dollar budgeted in BBB translates into the same contribution to disincentives as each dollar expected to be spent on the expanded subsidies for exchange plans.

I assume that the effects on restraining competition in labor markets are the same as Council of Economic Advisers (2019) found for four Obama-era regulations intended to bolster unions (the Fiduciary rule, the Persuader rule, and two joint-employer rules).  I assume that the Green Energy components of BBB contribute one-fifth to the labor wedge of what Fitzgerald, Hassett, Kallen and Mulligan estimated for Biden’s campaign promises regarding renewable energy.

Many of the details of the BBB programs will remain unknown until it becomes law and executive agencies issue their rules for administering them.  Although I assume that benefit takeup is well under 100 percent, I may still have overestimated it in which case BBB would be more of an adverse productivity shock and less of a work disincentive.

[Adverse productivity shocks tend to have comparatively small employment effects and large adverse effects on wages, capital investment, and living standards.  As such, they have a lot in common with BBB’s prescriptions for higher marginal tax rates on corporate and noncorporate businesses, which are not analyzed here.  I have also not yet quantified the disincentive effects of various unemployment-benefit sweeteners in BBB, such as the Section 137507 that makes exchange plans essentially free during any calendar year in which a person has unemployment compensation.]

[Update: Many economists studying the EITC and CTC give a lot of attention to the option of having zero earnings during a full calendar year.  It is a fact that BBB gives almost every parent a significant bonus for choosing that option.  I find this option to be hardly relevant for a large majority of adults, but another approach would be to conclude from welfare reform and EITC changes that low-skill single mothers will be very responsive to the BBB's new subsidies for zero work.  If so, perhaps I underestimate the national employment effect by a million or so.  Thanks to Kevin Corinth, Bruce Meyer, Matthew Stadnicki, and Derek Wu]

[2nd update: BBB reduces childcare costs for some families and increases it for others.  Most important for these purposes, the bill's new childcare subsidies introduce a new set of income phaseouts much like Obamacare did in 2014.  Including the various childcare/credit programs, I now project BBB's employment impact to be -9 million.]

As a younger Barack Obama put it (watch for about 80 seconds), "I am absolutely convinced ... we have to have work as the centerpiece of any social policy."]

Sunday, December 29, 2013

Welfare Benefits for Big Business?

Copyright, The New York Times Company

News reports have emerged this year that some of the nation’s largest and best-known corporations – like Walmart and McDonald’s – may have disproportionate numbers of their employees taking part in public assistance programs like Medicaid and food stamps. A video that went viral on YouTube criticized McDonald’s for offering its employees assistance with navigating the complex web of federal government assistance programs.

Most public assistance programs are aimed at poor people and limit participants’ incomes to a maximum somewhere around the poverty line (about $20,000 a year for a family of three). Because jobs generate incomes, it’s difficult for a worker to be admitted into antipoverty programs unless he or she works part time or earns near the minimum wage. Thus, it is no surprise that employers like McDonald’s and Walmart offering part-time or minimum-wage positions would have a disproportionate number of their employees in such programs.

One point of view is that employers just want to be helpful, and some of them happen to be in a line of business where they can create job opportunities for low-skilled people, many of whom can also benefit from knowledge about antipoverty programs. But critics assert that low pay is a deliberate corporate strategy to use government program revenues to enhance their bottom line.

Economists have long cataloged the winners and losses from antipoverty programs – we call it the “economic incidence” – and the answer is more subtle than either side acknowledges.

First and foremost, antipoverty programs raise wages and reduce profits in the short run because they implicitly penalize work, especially the full-time work that is most likely to raise an employee above the poverty line. In effect, employers not only have to compete with each other for employees, but they have to compete with the welfare state, too (as a recruiter, Stacey G. Reece, explains in his congressional testimony).

But the welfare state may also give big employers an advantage over small employers. Big employers achieve a scale large enough to host a number of employee benefit programs from education assistance and retirement plans to advice and assistance with welfare programs that small employers cannot afford. Going forward, I expect that large employers will offer more help for employees to navigate the Affordable Care Act than small employers will.

Although the earned-income tax credit is an exception, many safety-net programs permit participation on a part-year basis, which conveys an advantage to seasonal businesses, large and small. Employees at seasonal businesses have two sources of income – an employer paycheck during the parts of the year that they’re on the payroll and government program benefits during the rest of the year – while employees at nonseasonal businesses just have one income source.

Government transfer payments move purchasing power from those who finance the programs – taxpayers and the buyers of government debt – to the transfer programs’ participants. The transfers hurt businesses that serve, or borrow from, the program financers but may help businesses who serve transfer program participants. Walmart and McDonald’s may be among the latter group, too.

On the whole, social safety-net programs make it more costly to do business but nonetheless may confer competitive advantages on particular types of businesses.

Thursday, August 29, 2013

Behind the Big Increase in Food Stamps

Copyright, The New York Times Company

Something unusual has been happening with the food-stamp program, now known as SNAP, for Supplemental Nutrition Assistance Program. Between 2007 and 2012, spending on SNAP more than doubled, adjusting for inflation and population growth.

Paul Krugman and others attribute essentially all of the SNAP spending growth to the depressed economy. They have the general direction right – a more depressed economy will cause unemployment and antipoverty programs to spend more – but have missed the single largest factor increasing program budgets: program rules that are more generous now than they were in 2007.

Veterans benefits, Supplemental Security Income, Medicaid and Temporary Assistance for Needy Families all experienced a depressed economy, too, but they somehow managed through it without doubling their spending. Veterans benefits increased the most among these – 49 percent beyond inflation and population growth – compared with 110 percent for SNAP. (These data, which exclude administrative costs, can be found in the Bureau of Economic Analysis’ National Accounts Table 3.12.) Even state unemployment benefit spending, which is directly linked to layoffs in the economy, increased “only” 24 percent beyond inflation and population growth.

Peter Ganong and Jeffrey Liebman of Harvard have recently found (see Table 2 in their paper) that seven or eight changes in SNAP eligibility have spread across the states in recent years. They have examined county-level data on SNAP participation and other variables in order to estimate quantitative importance of some these rules. They find that between 2007 and 2011, new eligibility rules by themselves added 3.4 million people to SNAP enrollment and naturally tended to increase SNAP spending.

Perhaps 3.4 million seems small for a program that enrolled 26 million people before the recession. However, at the same time, SNAP began to pay more generous benefits to people who enrolled. Although changing benefit formulas is not part of Mr. Ganong’s and Professor Liebman’s paper, the new formulas would have increased SNAP spending more than 25 percent even without any new enrollment. Combined, the spending impact of enrollment and benefit rules is remarkable.

The chart below reports two estimates of the sources of SNAP spending growth: the one on the right, which builds on the Ganong-Liebman enrollment findings, and the one on the left, based on enrollment results I obtained earlier using somewhat different methods. (The Ganong-Liebman paper does not attempt to measure the combined effect of new benefit and eligibility rules between 2007 and 2011). The vertical axis measures the increase in SNAP program spending between 2007 and 2011, measured in 2007 dollars per American per year. All Americans are in the denominator – not just those who participate in SNAP – so that more participation in SNAP increases spending measured this way.

The total increase is $112 per person per year. Part, but not all, of the $112 can be attributed to more generous benefit formulas and more inclusive eligibility rules. That part is shown in red. My estimates say that, without a depressed economy, inflation-adjusted SNAP spending per capita would have increased $77 because SNAP rules changed. Using the enrollment estimates of Mr. Ganong and Professor Liebman together with the changes in benefit formulas suggests the increase would have been $53.

The remaining or unexplained spending increase is potentially attributable to the depressed economy, although it could be attributable to changes in the conduct of the SNAP that have not yet been quantified. For example, the Department of Agriculture has perennially attributed some of the increase in program participation to its outreach efforts – that is, advertising, promotional and other activities that encourage eligible people to join the SNAP program. Mr. Ganong and Professor Liebman note that enrollment itself may react to more generous benefits, as high benefits are likely to have encouraged more households to participate. These are effects that should be included in the red area in the chart but have been left as part of the blue “unexplained” area because of the lack of quantitative estimates.

The United States had a food stamp program before the recession that automatically included more households as circumstances put their incomes near or below the poverty line. The newest estimates suggest that going back to the 2007 SNAP program rules would annually save taxpayers at least $53 per American – that’s $212 for every family of four – and put SNAP spending back in line with spending on other antipoverty programs.

Wednesday, February 6, 2013

Earned Income Ironies

Copyright, The New York Times Company

The “earned income tax credit” is, ironically, more likely to be received by unemployed people than by workers who do not spend any time unemployed.

The credit was created years ago to reduce tax burdens on the poor and to “provide a genuine incentive for working;” a household must have some wage and salary income in order to receive the credit.

However, because the credit is administered on a calendar-year basis and is phased out with calendar-year wages and salaries, it is disproportionately received by people unemployed after a layoff.

As I illustrated in an earlier post, the credit follows a mountain-plateau pattern: an increasing portion for the lowest calendar incomes, a flat portion, a decreasing portion and then a flat portion of zero.

Internal Revenue Service

You might think that unemployed people do not receive the credit because they do not have any wage or salary income, but typically people unemployed from layoff do have wages or salary income during the calendar year of their unemployment from their previous job. Their layoff might have occurred after the beginning of the calendar year. Even a layoff occurring in December of the previous year might generate wage and salary income in the current year because of a severance payment or accumulated sick and vacation pay.

Moreover, an unemployed person might have a spouse with wage and salary income, and the spouse’s income counts toward the credit.

Because unemployment compensation is supposed to be reported on the recipient’s federal individual income tax return, I was able to further investigate this issue by examining a large sample of individual income tax returns for the years 2000-07 provided by the Internal Revenue Service to the National Bureau of Economic Research and other institutions for research purposes.

In 2007, 97 percent of the 7.6 million returns showing unemployment-compensation income (that is, the taxpayer or spouse was unemployed and receiving benefits some time during the calendar year) also had wage and salary income during the year. That percentage was essentially the same in each of the years 2000-06.

Of the same 7.6 million returns with unemployment income in 2007, one quarter received the earned income tax credit. By comparison, the credit was received by only one-sixth of the returns with wage and salary income but no unemployment income.

Among returns with unemployment income, the average earned income tax credit was $486, compared with $347 among the returns with wages but not unemployment income.

For most of the returns with both unemployment income and the earned income tax credit, the credit would have been even greater if the taxpayer had been employed fewer weeks than he or she actually was. Still more returns with unemployment income but no earned income tax credit would have received the credit if the unemployment had lasted longer.

This situation occurs so often because unemployment benefits are based on a person’s weekly work situation while the earned income credit is based on a household’s annual wages and salaries, and because weekly unemployment benefits by themselves are usually less than weekly wages and salaries.

The earned income tax credit is thus a good example of how a so-called tax credit can act like a tax from a working person’s point of view.

Monday, January 28, 2013

Making More Unemployed than Employed

By adding significantly to benefits for unemployed people without commensurate additions to the incomes of workers, the 2009 American Reinvestment and Recovery Act (a.k.a., "stimulus law") changed 100 percent taxation from a rare circumstance to one that presented itself to about five million household heads and spouses. If Congress had heeded the advice of those calling for a "bigger stimulus," as many as 13 million people would have made more unemployed than they would as workers. Watch this 19 min video to see how such high implicit tax rates became reality.


Viewers interested in more information on this topic: please look at http://www.nber.org/papers/w18591

It happens in Japan too (ht Austen Bannan).

Tuesday, January 22, 2013

Welfare Arithmetic Event Tomorrow


EVENT TOMORROW: American Action Forum Event Will Examine Stimulus Spending Effects on Welfare Efficacy


High Res Forum Logo


***EVENT TOMORROW***


American Action Forum Event Will Examine Stimulus Spending Effects on Welfare Efficacy


Speakers Include Jared Bernstein, Center on Budget and Policy Priorities; Casey Mulligan, University of Chicago; Shannon Mok, Congressional Budget Office
 

WASHINGTON - The American Action Forum (@AAF) will host an event tomorrow, Wednesday, January 23 examining the link between stimulus spending and welfare efficacy. University of Chicago Professor Casey Mulligan will first present findings from his recent paper, “The ARRA: Some Unpleasant Welfare Arithmetic.”  Following the presentation, AAF’s Director of Fiscal Policy, Gordon Gray, will moderate a discussion on the paper’s implications between Jared Bernstein of the Center on Budget and Policy Priorities and key contributor to the design of The ARRA and Shannon Mok of the Congressional Budget Office and lead author of a recent CBO report on effective marginal tax rates on low and middle income workers. RSVP here. Watch live online here.


WHEN: Wednesday, January 23th from 9:00AM – 10:30AM


WHAT: Getting Employment Incentives Right: ARRA and Marginal Effective Tax Rates


WHERE:


National Press Club, Holeman Lounge

529 14th Street Northwest

Washington, DC 20045


RSVP: http://arra.eventbrite.com/#


LIVE STREAM: http://www.visualwebcaster.com/event.asp?id=91799


AGENDA


8:30 AM: Doors open, breakfast will be served


9:00 AM Presentation: “The ARRA: Some Unpleasant Welfare Arithmetic”


Casey Mulligan, University of Chicago


Discussants:


Jared Bernstein, Center on Budget and Policy Priorities

Shannon Mok, Congressional Budget Office


Panel discussion will include time for audience questions.


Moderator:


Gordon Gray, American Action Forum


10:30 AM Conclusion


For press inquiries, contact Noelle Clemente at nclemete@americanactionforum.org or 240-888-7310.


Try Email Marketing with VerticalResponse!


Sunday, January 6, 2013

Do U.S. Welfare Programs have Work Requirements?

I received this question from Kurt Lassberg:
"Did the Obama administration gut the work requirement for welfare reform? I'm hearing some (Chris Matthews for one) say this is a lie. What is the truth?"
If welfare is narrowly defined to be Temporary Assistance to Needy Families, then the point is debatable, although the answer is still probably yes (see this comment).

But food stamps is a much bigger program, and for food stamps there is no debate: the Obama administration did eliminate work requirements with its stimulus law and since the law expired has continued to waive those requirements for any state that requests a waiver (about 45 states requested and received). The legislative and regulatory details are in my book The Redistribution Recession.

I suspect the debaters you see are talking past each other on the work requirement subject: one side with a narrow definition of welfare that excludes food stamps and the other with a broader definition including food stamps.

A key point in my book is that an economic analysis of our current economic woes must consider the government social safety net as a whole.

Saturday, December 22, 2012

Flashback: The Labor Economics of the Individual Mandate

20 years ago, experts used to recognize that "solving" the health uninsurance problem would create labor market problems.

The individual mandate triggers the added problem of confronting low income families with relatively high losses in incremental disposable income as earned income rises. For example, suppose insurance for families at or below the official poverty line were fully subsidized by the government ... [the] melting away of the subsidy is equivalent to a marginal income tax rate for the loss of health insurance subsidies alone of about 35 percent ... Added to federal income taxes, Social Security taxes, and the phaseout of the earned income credit, the individual mandate thus would present millions of low-income American families with total marginal tax rates in excess of 75 percent. Such high marginal tax rates may well make unemployment and welfare an attractive alternative to working. [emphasis added]

The was published in 1994. Guess who wrote it?


...Alan B. Krueger and Uwe E. Reinhardt. Krueger is now Chairman of the President's Council of Economic Advisers. Interestingly, 15+ years later the Administration did not mention high marginal tax rates as one of the unfortunate byproducts of the ACA, and no adjustment has been made for their depressing effects on the labor market and on government revenues.  Moreover, Krueger and Reinhardt (and dozens of other accomplished economists) signed a 2011 letter to congress touting their "strong conclusion that leaving in place the Patient Protection and Affordable Care Act of 2010 will ... promote more rapid economic recovery in the immediate years ahead."

Now it is considered partisan to acknowledge the basic economics of incentives, and that "[ACA propoents] can honestly say that economic and clinical claims made on behalf of the repeal effort are generally viewed as non-substantive."

Wednesday, December 19, 2012

A Tale of Two Welfare States


Copyright, The New York Times Company

In “A Tale of Two Cities,” Dickens wrote, “It was the age of wisdom, it was the age of foolishness.” The governments of the United States and Britain are embarking on different approaches to helping their poor and unemployed, and one of them may regret its policy decisions.

As recently as 2010, Britain had a complex system of antipoverty programs including housing benefits, job seekers’ allowances and mortgage-interest assistance. With so many benefits available, many people found they could make almost as much from the combined programs as they could from working, even while any one of the benefits might not have been all that significant by itself. As Britain’s Department for Work and Pensions described, beneficiaries remained “trapped on benefits for many years as a result.”

Beginning next month, Britain will strive to put its welfare system on a different path by unifying many programs under a single “universal credit” system, what the department describes as an “integrated working-age credit that will provide a basic allowance with additional elements for children, disability, housing and caring.” The department forecasts that its “universal credit will improve financial work incentives by ensuring that support is reduced at a consistent and managed rate as people return to work and increase their working hours and earnings.”

In the United States, the welfare system includes dozens of federal programs, enumerated by Robert Rector of the Heritage Foundation as those “providing cash, food, housing, medical care, social services, training and targeted education aid to poor and low-income Americans.” Beginning in 2014, more programs will be added and expanded by the Patient Protection and Affordable Care Act: new health-insurance premium-support programs, new cost-sharing subsidies for out-of-pocket health expenditures, financial hardship relief from the new individual mandate penalties, new subsidies for small businesses employing low-income people and expansion of Medicaid.

The Congressional Budget Office estimates that the Affordable Care Act’s means-tested subsidies and cost-sharing will implicitly add more than 20 percentage points to marginal tax rates on incomes below 400 percent (see Page 27 of the C.B.O. report) of the poverty line (a majority of families fit in this category) by phasing out the assistance as family incomes increase, although a number of families will not receive the subsidies because they already get health insurance from their employer.

These marginal tax-rate additions are on top of the marginal tax rates already in place because of personal income taxes, payroll taxes, unemployment insurance, food stamps and other taxes and means-tested government programs. In 2014, some Americans will be able to make almost as much from combined benefits as they would by working, and sometimes more.

In summary, the United States intends to move in the direction of more assistance programs and higher marginal tax rates, while Britain intends to move in the direction of fewer programs and lower marginal tax rates.

Either country, or both, may ultimately fail to fully carry out the new programs by granting waivers and exceptions, refusing to administer them or by rewriting its new laws. But if both do follow through, perhaps future empirical economic research comparing the United States and Britain will reveal which country is living an age of wisdom and which one in an age of foolishness.

Monday, December 17, 2012

Work Can be Too Expensive

The U.K. did a survey of non-employed participants in their various anti-poverty programs.  87 percent expressed concerns that going to work, rather than remaining on benefits, would be too expensive.  Here are some more details:

"By far the biggest concerns about leaving benefit were financial. Nearly one quarter (23 per cent)
mentioned the ‘earnings gap’ in one form or another:
• 15 per cent were worried about having to wait for their first pay day;
• seven per cent were concerned about having to pay bills before they started receiving pay;
• one per cent were anxious about getting into debt before they started receiving pay.

Other common financial worries included not having enough money to live on (14 per cent), not being
able to pay bills (14 per cent), the job not paying well (11 per cent), and not earning enough to pay the
rent (nine per cent).
Collectively, nearly nine in ten respondents mentioned some sort of financial concern in this
unprompted format (87 per cent)."

Read the full report here.  Of course, these things do not happen in America.

Friday, December 14, 2012

Did Poverty Rise or Fall?

Adjusted for taxes and benefits.

Aloc Sherman says it was constant.

Jared Bernstein says America had “the deepest recession since the Great Depression and poverty didn’t go up.”

Shawn Fremstad says says "Social insurance and the Obama Stimulus, limited as it was, have and continue to play a fundamentally important role in limiting the damage. But even taking that into account, real poverty really did rise during the recent recession."

Contrary to Mr. Fremstad's claims, my post on this matter clearly explains that I do not have my own estimate and that "The measurement of poverty and its trends is an important and continuing research area, and future research could suggest that the poverty rate had increased."   Perhaps Sherman and Bernstein are wrong. Perhaps they are right. Maybe what Mr. Fremstad really advises is not to rely on Sherman and Bernstein.

Thursday, December 13, 2012

The Microeconomics of Poverty since 2007

Copyright, The New York Times Company

Government safety net programs were put on steroids by the 2009 stimulus law, erasing incentives for a significant fraction of the unemployed.

Last week I noted that poverty, when measured to include taxes and government benefits, did not rise from 2007 to 2011. That result, I contended, indicated that people in the neighborhood of the poverty line faced marginal tax rates of about 100 percent. I also noted that 100 percent marginal tax rates were excessive.

These three statements generated many angry comments, so it’s worth examining them in more detail.

One possibility is that the poverty rate did rise significantly, even when adjusted to reflect taxes and government benefits. That possibility would contradict Jared Bernstein’s work in this area, because he concluded that America had “the deepest recession since the Great Depression and poverty didn’t go up.” It would also contradict Arloc Sherman’s findings that the poverty rate was essentially unchanged (thanks to generous new subsidies).

The measurement of poverty and its trends is an important and continuing research area, and future research could suggest that the poverty rate had increased. However, future research could also point in the other direction.

In 1995, a panel established by the National Research Council to evaluate poverty measurement concluded that it might make sense to recognize not only the monetary resources available to families, but also the amount of free time they had. After 2007, many people found themselves with less pretax income and more free time because they had lost their jobs. Because the official poverty measures consider only the pretax income, adjusting poverty measures to reflect free time would cause the poverty rate to fall more, or increase less, after 2007.

Assuming for the moment that Mr. Bernstein and Mr. Sherman are right about the poverty changes, a second possibility is that poverty failed to rise even while marginal tax rates were significantly less than 100 percent. As one blogger put it, “Just because poverty rates didn’t rise doesn’t mean that the government imposed a 100 percent implicit tax rate.”

One might wonder exactly how, in theory, poverty rates remained fixed when millions of people lost their jobs, and when the government did not essentially replace all the disposable income lost because of layoffs. The magnitude of marginal tax rates imposed by the government is ultimately an empirical question, though. As far as I know, none of my detractors have offered any estimates.

I have been examining marginal tax rates under the American Recovery and Reinvestment Act of 2009, especially as experienced by families near the poverty line. The chart below shows some of my results pertinent to Mr. Bernstein’s poverty measures.

The chart examines households that in 2007 had household income of less than 175 percent of the poverty line and were therefore at risk of falling into poverty if they were later laid off from their job. The chart organizes unemployed heads and spouses in terms of their marginal tax or “job acceptance penalty” rate. With that rate, I mean the fraction of a person’s employee compensation that goes to federal, state and local government treasuries or to expenses associated with commuting to work (I assume that is $5 for each one-way trip) as a consequence of working full time at the same wage as before layoff rather than remaining unemployed. (The remainder of the worker’s compensation, if any, is left to enhance the disposable income of the worker and the worker’s family.)

The chart also organizes unemployed people in terms of what they earned weekly before layoff, with special attention to the group in the $250 to $349 range, which is near the weekly earnings of a full-time minimum-wage job.

Among the unemployed who had earned near minimum wage (shown in red in the chart), a majority had a job-acceptance penalty rate of at least 100 percent, meaning that accepting a job with the same pretax pay as they had before layoff would not increase their disposable income. If they were to accept such a job, all the compensation would go to the Treasury in additional personal income taxes, additional payroll taxes and reduced unemployment insurance benefits (under the stimulus, unemployment insurance benefits alone were more than half of the pretax pay from the previous job), and in some cases reduced benefits from the Supplemental Nutrition Assistance Program, known as SNAP, and Medicaid.

Only 18 percent of those earning near minimum wage had a job-acceptance penalty rate of less than 80 percent.

My results consider the unemployment insurance program and its federal additional compensation and subsidies for Cobra, which gives workers who have lost their jobs the right to purchase group health insurance for a limited period of time; SNAP; Medicaid; the regular personal income tax (both federal and state); the earned-income tax credit, the child tax credit, the additional child tax credit and the “making work pay” tax credit.

Job-acceptance penalty rates of 100 percent or more are probably more prevalent than shown in the chart because I did not include child care costs among employment expenses and did not include programs like disability insurance, Temporary Assistance for Needy Families and Supplemental Security Income, means-tested housing subsidies, means-tested tuition assistance, means-tested energy-assistance programs and other programs that impose positive implicit marginal tax rates.

I agree with Mr. Bernstein that government policy, especially the 2009 stimulus law, is responsible for preventing a rise in the poverty rate. But it achieved that end by erasing incentives for a significant fraction of the unemployed.

Thursday, December 6, 2012

The ARRA: Some Unpleasant Welfare Arithmetic


Food stamps, unemployment insurance, and other subsidies to persons who are unemployed and otherwise with low incomes, have recently been made more generous and available in more situations.  Did extra transfers help prevent a deeper recession, or did it amplify and prolong it?  Economists cannot fully answer these questions without examining the incentives of persons receiving the transfers.  The purpose of this paper is to quantify the number of people who recently had essentially no short-term financial reward from working, and how that number might have been different if safety net program rules had been made more generous, or if they had remained what they were in 2007.
American economists often discuss the unemployment insurance (hereafter, UI) system and its moral hazards as if the penalty for accepting a new job were about 50 percent of compensation,[1] which would suggest that the financial reward to working would be positive and significant in all but a few rare circumstances.  At the same time it is commonly noted that the average weekly unemployment benefit of about $300 barely exceeds the compensation from a full-time minimum wage job, and for this reason alone UI is almost always inferior to a real paycheck.  These claims are incorrect because they ignore payroll taxes, income taxes, and other safety net programs.  The tax arithmetic suggests that many UI participants would, even under 2007 rules and even ignoring all safety net programs aside from UI and the personal income tax, keep about 30 percent – and maybe as little as ten percent – of the compensation generated by accepting a new above-minimum-wage job because taxes typically took as much of the reward from working as foregone unemployment benefits did.  These thin margins essentially disappeared under the American Recovery and Reinvestment Act of 2009 (hereafter, ARRA).
Even when helping the poor is a primary policy motivation and the wage elasticity of labor supply is low, optimal tax theory frowns on labor income tax rates that equal or exceed one hundred percent (as long as work is not socially harmful) because at a one hundred percent rate there is no longer a tradeoff between efficiency and government revenue.  From a positive point of view, economists expect that employment rates will be low, if not zero, in groups of people who are aware that they receive no financial reward from working.  These are a couple of more reasons to quantify the prevalence of marginal tax rates that are near or exceed one hundred percent.[2]
The paper begins with a brief overview of the major safety net programs affecting the financial reward to working.  The first quantitative results are 2009 marginal tax rates and their components for some of the more common tax situations encountered by American workers and their families.  The rates are calculated for three scenarios: actual benefit and tax rules, benefit and tax rules as they would have been if they had not been changed since 2007, and benefit and tax rules as they might have been in a bigger stimulus.  The following section considers the rich and complicated variety of possible tax situations in order to arrive at estimates of the number of household heads and spouses with little or no financial reward to accepting a new job.  A “demand shocks and job search gambles” section shows how job acceptance rewards are nonlinear in the amount of a job offer, and the final section concludes.

Conclusions

            Before the recession began, going from unemployment back to work did not pay that well for someone eligible for unemployment benefits, but almost always paid a little something, with at least twenty percent of compensation from a job going toward enhancing the new employee’s disposable income above what it was during the spell.  Despite its inclusion of a “making work pay” tax credit and its expansion of the “earned income tax credit,” the ARRA increased marginal tax or “job acceptance penalty” rates for the vast majority of the unemployed and essentially erased the short-term financial benefits from working for two to three million non-elderly and unemployed household heads and spouses.  About five million had their job acceptance penalty rates increased above 80 percent by the ARRA.
Layoffs have also long been subsidized by unemployment insurance and other safety net programs, but again typically public treasuries would pay for less than 90 percent of the compensation lost from a layoff, while employer and employee had to absorb the rest.  When the ARRA was in full force, over three million workers could be laid off with a subsidy of 90 percent or more, and another five million with a subsidy rate of 80 to 89 percent.  A bigger stimulus would have put as many as 30 million workers in that situation.
To the degree that unemployment responds to the financial incentives for working, the ARRA and other programs assisting the unemployed interact with demand shocks in determining the number unemployed: an adverse demand shock increases unemployment more under the ARRA than it would if the same demand shock were experienced under 2007 tax and subsidy rules.
None of these results hinge on the increase of the duration of unemployment benefits from 26 to 99 weeks, which was achieved by legislation separate from the ARRA (United States Department of Labor 2011).  I count each unemployed person only when they are laid off; the results here reflect the level of benefits delivered by tax and subsidy programs to unemployed persons beginning to receive UI.  UI and other program eligibility rule changes are not considered in this paper but are important for quantifying changes in marginal tax rates between 2007 and 2009, and comparing such changes across demographic groups.
My findings of large, even confiscatory, job acceptance penalty rates are not the result of “cliffs” in transfer program formulas in which many dollars of benefits are lost for earning a particular marginal dollar (Yelowitz 1995) because I look at the consequence of more “discrete” decisions of accepting a job, or initiating a layoff, that change calendar year income by thousands of dollars.  Instead, my large rates reflect the combination of tax and subsidy rules, especially unemployment insurance.  Not surprisingly, my rate estimates exceed those of previous studies of transfer program marginal tax rates that omit unemployment insurance (Holt and Romich 2007) and exceed those of previous studies of unemployment insurance that ignored taxes (Chetty 2008).  But taxes, unemployment insurance, and other transfer programs have recently contributed significantly to the living standards of the poor and unemployed (Sherman 2011), so we cannot have a full understanding of the magnitude of marginal tax rates without considering the safety net broadly.
I have likely somewhat under-estimated the number of people with marginal tax rates in excess of one hundred percent because I have omitted a number of other possible sources of implicit taxes.  They include other means-tested cash assistance programs such as Disability Insurance, TANF and Supplemental Security Income; means-tested housing subsidies; means-tested tuition assistance; and means-tested energy assistance programs.  They also include court-enforced wage garnishment associated with the collection of delinquent consumer, tax, and child support debts.
            At the same time that incentives to retain and accept jobs were erased for millions, millions were laid off from their jobs and remained unemployed for an extended duration.  I estimate that 2.3 million additional non-elderly household heads and spouses were laid off in 2009 than would have been laid off if the 2000-2007 average number of layoffs had persisted through 2009.  The number of unemployed household heads and spouses were about 5 million greater than normal.  In other words, the extraordinary numbers of persons laid off and unemployed are of roughly the same magnitude as the numbers of persons having their incentives essentially erased by the ARRA.  The fact that more persons would have had incentives erased if the ARRA had been more generous to the unemployed suggests that it is possible that a bigger stimulus would have resulted in more unemployment than the actual stimulus did.
            It is beyond the scope of this paper to quantify the impacts that the large penalties for work from the ARRA (or other legislation) had on the labor market for people laid off during the recent recession.  Nor do I attempt to determine whether increasing marginal tax rates beyond 100 percent matters more or less than increasing them beyond, say, 70 percent.  But even before obtaining such estimates we should not expect that a labor market would function normally while the private benefit to working was zero or negative.  For this reason, the arithmetic presented in this paper is indeed unpleasant, and disturbingly similar to discredited welfare program rules of the distant past.  As James Tobin put it in 1965,
“[A 100 percent tax rate] does just that, causing needless waste and demoralization.  This application of the means test is bad economics as well as bad sociology.  It is almost as if our present programs of public assistance had been consciously contrived to perpetuate the conditions they are supposed to alleviate.” (Tobin 1965, 890)


[1] Chetty (2008) estimates the U.S. UI replacement rate as 50 percent for the purposes of demonstrating that it might be slightly less than optimal.  See also Fujita (2010).
[2] Behavior in the neighborhood of 100 percent tax rates would be especially interesting if it were true that (a) when tax rates are lower and more typical of their historical values, the amount of unemployment were insensitive to the amount of the UI benefits and (b) unemployment would be high if unemployment paid better than working.  To see this, try drawing a graph of the relationship between unemployment and the size of UI benefits that satisfies the properties (a) and (b): it must turn or jump sharply toward high unemployment as the benefit approaches the amount of pay from working.

Wednesday, December 5, 2012

Poverty Should Have Risen

Copyright, The New York Times Company

When measured to include taxes and government benefits, poverty did not rise between 2007 and 2011, and that shows why government policy is seriously off track.

When somebody earns, say, $10,000 by working, he should keep some of it for himself and his family rather than handing it all over to the government. By the same reasoning, when someone loses $10,000 by not working, he should get some help from the government or from others in the forms of reduced taxes and enhanced benefits but still should bear a portion of that loss himself.

Economists debate the fraction of wages that workers should keep for themselves, because the optimal fraction is a trade-off between incentives, insurance, support of public goods, freedom and other factors. Libertarians and other believers in small governments might set the fraction at 80 percent or more. Other economists think that incentives have an effect on behavior, but incentive effects are small, so we can safely set the fraction at 30 percent, or even a bit less.

But I thought economists agreed that the fraction should not be zero, so that people losing money by not working would bear a portion of the loss. If people with declining incomes found them entirely replaced by government help, that amounts to 100 percent taxation (providing more benefits as income falls is sometimes called “implicit taxation”).

As James Tobin, a John F. Kennedy adviser, Nobel laureate and leading Keynesian economist of his day, said in a 1965 article, a 100 percent tax rate causes “needless waste and demoralization,” adding:

This application of the means test is bad economics as well as bad sociology. It is almost as if our present programs of public assistance had been consciously contrived to perpetuate the conditions they are supposed to alleviate.

Professor Tobin called the 100 percent tax situation demoralizing because the affected people find that all of the benefits of their hard work and success go to the government in the form of more tax receipts and fewer benefit payments. The unintended result would be less work and more families earning less than the poverty line, which is why Professor Tobin described such policies as perpetuating poverty.

If, as economists recommend, everybody’s tax rate is effectively less than 100 percent, then someone with disposable income of, say, 110 percent of the poverty line should find himself falling into poverty when he loses his job. His living standards would not fall to zero because he should be getting some help in terms of reduced taxes and increased benefits. But optimally his disposable income would fall to 80 percent of the poverty line, and perhaps below, until he found a new job.

Under the Obama administration, workers with disposable income in the neighborhood of the poverty line did not, on average, see their job losses during the recession translate into significant reductions in their disposable income.

As Jared Bernstein put it, America had “the deepest recession since the Great Depression and poverty didn’t go up.” He shows that the percentage of people in households with disposable income less than the poverty line was 15 percent in 2011, just as it was in 2007 before the recession began. In fact, the percentage fell a bit after 2008 when the stimulus law went into effect.

The results suggest that the government was helping too much. If they had been following the advice of Professor Tobin and all other economists who say they believe that tax rates should be less than 100 percent, the fraction of households with disposable income below the poverty line would have risen as a consequence of millions of lost jobs, just less than it would have without any government help.

Mr. Bernstein, one of the Obama administration advisers who designed the stimulus law and said it would quickly push the unemployment rate below 8 percent, appears to be unaware that it is possible for the government to help too much by creating the kind of situation Professor Tobin described and depress the economy in the process. Mr. Bernstein fails to mention incentives in any way and instead describes the poverty results as “a real accomplishment and a sign of a far more civilized society.”

Erasing incentives is not the way to a civilized society but rather to an impoverished one.