Wednesday, March 11, 2020

Subsidizing Addiction

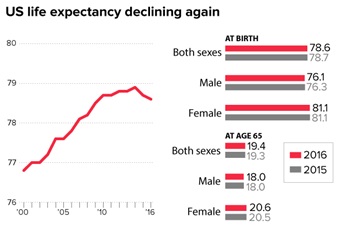
In both 2015 and 2016, U.S. life expectancy fell from the previous year. A single-year drop had not happened in 22 years, and two consecutive drops had not occurred in more than 50 years. This sharp reversal in the national trend toward longer lives is widely understood to be connected to the opioid epidemic that began in the 1990s. The best kept secret about the epidemic, however, is how much of it – arguably most of it – resulted from Federal policy changes initiated by both Democrats and Republicans.

Opioids include prescription drugs like oxycodone as well as illicitly manufactured drugs like heroin and fentanyl. Since 2000, the Federal government has increased subsidies on both types of opioids and cut taxes on illicit opioids.

Medical professional organizations like the American Pain Society have been criticized for recommending more aggressive opioid prescription practices and downplaying addiction risks. But the effects of their recommendations would have been less severe without the Federal dollars that supported them. Beginning in 2000, the Veterans Health Administration (part of the Federal government) mandated that pain be seen as “the 5th Vital Sign,” which meant that pain would be routinely screened for and documented primarily based on patient self-assessments. Years later, the new Secretary of Veterans Affairs would report that veterans were twice as likely to die from opioid overdose than the general population.

This new approach would soon enter into civilian practice too, with three phases of financial encouragement from the Centers for Medicare and Medicaid Services. CMS has long conditioned hospital reimbursement under its massive Medicare and Medicaid programs on hospital quality assessments by the Joint Commission on Accreditation of Healthcare Organizations, another accreditation organization, or state survey agencies. In 2001, pain management became part of the accreditation process, putting billions of CMS dollars at stake. The second phase of incentives began in 2007, when CMS began withholding two percent from full reimbursement if a hospital failed to participate in the patient survey known as HCAHPS; hospitals and doctors discovered that their performance on the survey improved if opioids were liberally prescribed. The third phase began in 2012, when CMS implemented the “valued-based purchasing” (VBP) requirement provided for by the Affordable Care Act, which tied hospital reimbursement even more strongly to the HCAHPS survey. CMS would spend the next seven years taking steps to reduce these financial incentives for aggressive opioid prescribing.

Federal subsidies benefiting opioid consumers were probably even larger. In 2006, Medicare began to cover prescription drugs pursuant to its new “Part D” program. Although most Medicare enrollees are elderly, many of their prescriptions ended up in the hands of nonelderly people. Citing a family physician from Ohio, Sam Quinones’s book Dreamland asserts that “seniors realized they could subsidize their retirement by selling their prescription Oxys [a potent opioid] to younger folks. Some of the first Oxy dealers, in fact, were seniors who saw the value of the pills in their cabinets. ‘It’s like hitting the Lotto if your doctor will put you on OxyContin…. People don’t even think twice about selling.’” The White House Council of Economic Advisors (CEA) estimates that three-fourths of the growth in prescribed opioids between 2001 and 2010 were financed by government programs.

The 2010 Affordable Care Act requires health plans (especially Medicare) to cover “benzos” – prescription tranquilizers like Valium and Xanax. Benzos are part of the opioid crisis because they are the other half of the risky opioid-benzo cocktail that is favored by many opioid abusers. The tranquilizers enhance the feelings connected to opioid consumption, including the consumption of heroin and fentanyl. In other words, unlike the 2006 Medicare subsidies, which apply only to prescription opioids, the ACA’s benzo subsidies increase the demand for illicit opioids too.

In 2013, Attorney General Eric Holder took a step toward ending the war on drugs by instructing Federal attorneys that they should not prosecute low-level drug offenders. As I explain in my recent paper, this amounts to a tax cut on illicit opioids that would presumably reduce their street prices.

As far as I can tell, these policies went ahead because much of the Federal government did not grasp the full extent of the opioid epidemic. The Federal Register (the daily publication of US government agencies), reveals the Federal priorities at the time. Every 10,000 pages published between 2009 and 2016 had only six documents mentioning “opioid,” “opioids,” or “opiate.” In contrast, the same 10,000 pages had nearly 40 documents mentioning “climate change.” As recently as 2013 – the third consecutive year in which the death rate was almost triple normal levels – the Congressional Record mentions “climate change” 27 times more often than “opioid” or “opioids.”

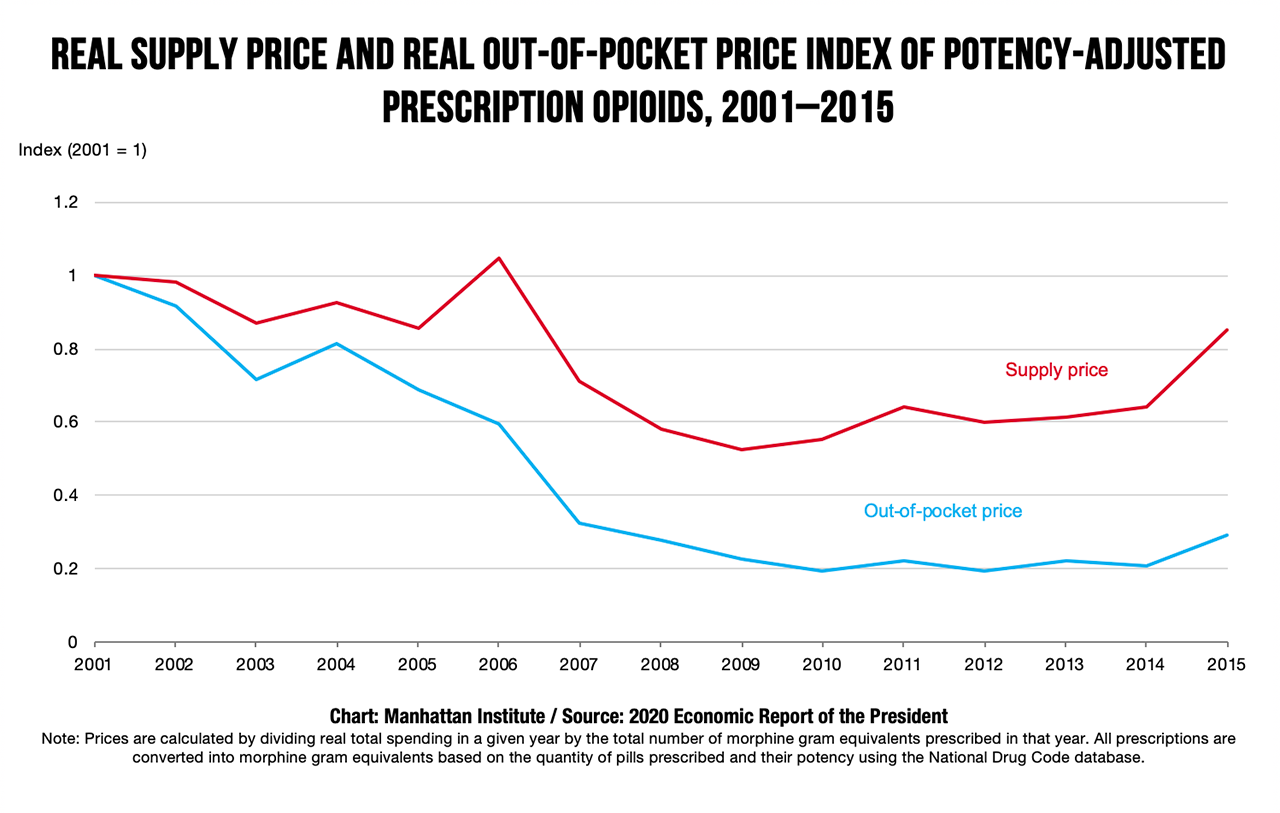
Regardless of whether the government increases subsidies or cuts taxes, the result is lower prices paid by the opioid consumer, making opioid addiction more affordable. The CEA’s recently released 2020 Economic Report of the President estimates that, adjusted for inflation, out-of-pocket prices for prescription opioids fell by a factor of five between 2001 and 2010. (CEA’s price data is graphed below.) More recently, the quality-adjusted price of illicit opioids fell by at least a factor of two.
subsidizing-opioid-crisis
Studies have shown that opioids and other addictive substances obey the law of demand: lower prices mean more demand. If nothing else, the reduced prices for opioids have sharply increased the number of people who can afford an opioid addiction. CEA estimates that lower prescription opioid prices explain 31 to 83 percent of the increase in the death rate from 2001 to 2010 involving prescription opioids. This estimate does not include the additional effects of subsidies for benzos or hospitals, or the effects of reduced heroin prices since 2010.

Without the new subsidies supporting opioid addiction, the number of fatalities from opioid overdoses would be significantly lower, and maybe it wouldn’t even be called an “epidemic.”


Wednesday, February 26, 2020

Challenger Sanders v Challenger Trump

Sanders and Trump both side with flyover country rather than the Washington bubble.  This approach is valuable on election days, albeit creating much personal inconvenience on the days in between.

As part of this, both will speak some of the truisms that are supposed to be off limits.  E.g., Trump's "American carnage" in his inaugural address (if you think that was not a truism, look here).  Or Sanders' admiration of the Cuban literacy campaign (as impressive as it was for literacy results, it was even more impressive as a political move, helping to cement Castro's power for many decades).

A difference between Sanders and Trump on this is that Trump simultaneously says the politically incorrect while expanding the boundaries of his brand.  He says the truth in a way that goads his opponents into vigorously denying that very truth.  "American carnage" is one example among many.  This is one of Trump's valuable skills for operating in our world where ideas do not have copyrights.  By contrast, when Sanders says something true he says it in a way in which competitors can adopt it for themselves.

Sanders is fundamentally an ideologue, whereas neither Trump nor voters are.  This allows Trump to take on political opponents, and even appreciate their strengths, without personally insulting their voters.  Sanders seems tied to a lot of dogma around social policy.  As long as Sanders has to repeat that Trump is supposedly "racist, sexist, homophobic, xenophobic" etc., he is in imminent danger of the basket-of-deplorables trap: describing half of America as the same or at least having them hear it that way.  I doubt Sanders realizes how similar he sounds to Mrs. Clinton on this subject.

As of 2016, neither Trump nor Sanders showed much allegiance to a political party.  This removes some constraints on their quest for electoral victory, but discards some of the value that party brings, such as credibly lengthening the planning horizon.  That value has to be replaced by something.  Trump helped replace it with his list of judge candidates.  And with long-horizon political aspirations for Ivanka and others.  I don't yet see what will be Sanders' replacement.

Trump is smarter.  Take the controversies that the two ignite.  By insisting that fracking be banned, Sanders seems unaware that Pennsylvania is a swing state.  By more easily acknowledging accomplishments of Castro than of Trump, Sanders seems unaware that Florida is a swing state filled with people who voted for Trump but not Castro.


(also an interesting exposition of "identification in difference-in-differences").

Today Trump is POTUS and has results to showcase.  POTUS Trump will be bragging about promises kept while Sanders through backchannels will be telling people not to worry that his promises will be kept.  But my purpose here is to compare them as challenger candidates.

Tuesday, February 25, 2020

Look at all of those CEA charts!


(Fox News shows CEA charts from "the brand new economic report from the White House" while the Secretary of Labor provides narrative).

The Economic Impact of Sanders’ Radical Agenda


If fully implemented, but otherwise implemented wisely, Senator Sanders’ agenda for the economy would reduce real GDP and consumption by 24 percent.  Real wages would fall more than 50 percent after taxes.  Employment and hours would fall 16 percent combined.  There would be less total healthcare, less childcare, less energy available to households, and less value added in the university sector.  Although it is more difficult to forecast, the stock market would likely fall more than 50 percent.

Previous analysis of Medicare for All

When I was at CEA, we used an extension of the neoclassical growth model to assess the economic impact of “Medicare for All” (M4A), which we charitably interpreted as 100 percent public financing of the health sector, with (in Chapter 8 of the 2019 ERP) nobody consuming less healthcare and many consuming more than in the baseline.  We also charitably assumed that the public financing would occur with taxes that have minimum efficiency loss per dollar collected.

Arguably the Laffer curve for payroll and consumption taxes is not high enough to finance M4A, but at CEA we charitably assumed that the tax base is inelastic enough to rule out this possibility.  As reported in the 2019 Economic Report of the President, we concluded that payroll tax rates would increase 14 percentage points and tax payments would increase an average of $18,000 per household per year.  Real national income and GDP would fall 9 percent.  Real national income net of taxes and health spending would fall 19 percent.  These result from M4A by itself, and are a best-case scenario.


Considering Sanders’ Agenda More Fully: Factors of Production

My purpose here is to consider Sanders’ agenda more fully, including free public college, free childcare, and a full transformation of the energy sector.  I will also consider the fact, confirmed repeatedly in history, that nationalizing industries will reduce their productivity.  Overall productivity will also decline somewhat as the economy is reregulated (including perhaps a $15 minimum wage and regulating employee-management relations) enough to be put on the pre-2016 regulatory growth path.  A Federal jobs guarantee or a student loan bailout would also not be pretty, but I have not yet quantified it.

I assume that what is currently household spending on public college tuition and on daycare (1.75 percent of aggregate consumption) will become “free” and that these resources will see their utilization increase by the same percentage as healthcare.  Under the assumption that a Sanders administration would provide Federal assistance to nonrich households that are burdened by the high energy prices that come with the Green New Deal, I also expand the Federal budget for that purpose by another two percent of baseline consumption.

Even if without any productivity loss or increased utilization in healthcare, college, and daycare, this means that the Sanders agenda would be expanding the Federal budget by 13.25 percent of baseline consumption.  Including 19 percent additional utilization of these “free” goods and services, tax rates on labor income must increase by 23.5 percentage points (it would be more but the Sanders agenda does expand the tax base by eliminating the exclusion for employer-sponsored health insurance).  GDP falls by 16 percent (this does not yet consider productivity losses -- that comes below).

The simple, correct, but perennially forgotten, idea is that it matters when we spend other people's money on other people.  Nationalizing an industry's revenue is NOT merely a matter of relabeling the dollars that people spend on that industry.  Moving the revenue over to the public purse removes all individual incentive to economize on the amount of spending and to ensure that the spending goes to the highest value activities.  The data matches the theory very well on this.


Considering Sanders’ Agenda More Fully: Productivity

The Sanders agenda puts the economy so close to the top of its Laffer curve that there is no additional revenue to finance the additional inputs into healthcare, college, and daycare that would be needed if those industries suffered any productivity loss.  If their productivity fell by 25 percent, which is optimistic as nationalizations go (see Chapter 8 of the 2019 ERP), then the output of those industries would have to be cut by 25 percent.  To be clear, the result would be less healthcare, less college, and less daycare.

The Sanders agenda will reregulate the economy.  I optimistically (i.e., charitably to the Sanders agenda) project the regulation to be a return to the pre-2016 regulatory trend plus cutting energy productivity in half.  CEA estimated that the pre-2016 trend was to reduce productivity by 0.16 percent per year (see Chapter 3 of the 2020 ERP), which would be 1.3 percent by 2024.  I also assume that a President Sanders would undo President Trump’s deregulatory agenda and his corporate tax cut and thereby reduce productivity by another 3.3 percent.  Taking energy as 3 percent of the economy, the climate change part of the Sanders agenda would (again, optimistically) reduce productivity by 3 percent.  Adding these to the productivity losses in the nationalized industries, that is 10.9 percent less productivity.

Overall, real GDP and consumption would fall 24 percent.  Employment and hours would fall 16 percent combined.  Real wages would fall 11 percent before taxes.  After-tax real wages would fall 51 percent.

This is akin to the Great Depression of the 1930s, except that the Great Depression was eventually followed by a recovery whereas the Sanders agenda (I assume) does not involve eventually putting policies back to the way President Trump had them.  Therefore the stock market would fall at least what it did in 1929, which was almost 50 percent.

Don’t Take Sanders Literally

As an academic exercise, I have taken Sanders literally.  That is not a good forecast of what his policies would be.  If nothing else, his promises are so damaging that the rest of our political system would water them down.  Indeed, Sanders surrogates such as AOC have been saying as much to assure (sic) nervous voters.

None of this denies that Sanders, whose candidacy I have followed for five years, is compelling.  Marxism itself is powerfully irresistible, surviving over a century in the marketplace for ideas.  But it's more than that.  Outside the Washington bubble, there is a demand for disruption rooted in real substance.  Not as much as in 2016, but still there.  People also understandably admire how Sanders' episodes of honesty are so frequent by the standards of conventional politicians.  My favorite example is his 2016 economics white paper, which openly acknowledges the existence of serious people with the opposite view (see especially footnotes 21 and 36), which is exactly the view I express above.


[Appendix on climate effects:

My GDP estimates do not include any climate damage.  M4A is a big part of the Sanders agenda, and has nothing to do with environment.  As shown in Chapter 4 of the 2020 ERP, banning fracking, which is part of the Sanders agenda, makes climate change worse.   To the extent that worse climate means less GDP for the U.S. (climate change is mostly a world GDP effect rather than U.S. GDP?), that would add to the GDP impact I calculated.  On the other hand, other parts of the Sanders agenda might help with climate change.  Also, whaat's above looks at economic impacts in a 5-10 year time frame, whereas effects through climate change will take decades.]


Monday, January 13, 2020

Is the Grand Canyon Just a Ditch?

[Originally posted at economics21.org]
The myriad deregulatory actions of the Trump administration are generating considerable cost savings, savings that even conservative critics of regulatory overreach are underestimating. Like the Grand Canyon, the vast scale of these deregulatory efforts (and their results) is hard to fathom.
In just three years the administration has reversed hundreds of regulations, many of which drone on for hundreds of pages. And it’s done so without fear or favor. Many of the regulations reversed had been written and implemented at the behest of special interests, including large banks, trial lawyers, major health insurance companies, big tech companies, labor unions, and foreign drug manufacturers. 
Even officials within the administration underestimate what has been achieved because they tend to grasp only their specific part of the overall picture. Still, I’ve been surprised to see a group of conservatives confidently conclude that the Trump administration “has achieved little” on deregulation. This, sadly, is akin to a human being encountering the immensity of the Grand Canyon only to conclude that it is “just a ditch.”
The daily grind of repealing excessive regulation does not always grab headlines. I don’t blame commentators for being unaware of some, or even most, of the deregulation that has occurred. That is why the Council of Economic Advisers (CEA)—where, until recently, I served as chief economist—dedicated a great deal of manpower preparing a comprehensive and rigorous assessment of deregulation since 2017. That report, released in June, concluded that the past three years of deregulation is comparable to, and probably exceeds, any deregulatory episode in modern U.S. history. That includes the historic deregulations of airlines, trucking, railroads, and energy that were initiated during the Carter administration.
Argue with the CEA report, if you want. Or read David R. Henderson’s summary of the report. But don’t claim that the Grand Canyon is a just a ditch until you have a cursory look at the CEA’s map.
The CEA began with the surprisingly difficult task of identifying the deregulations that were reducing household and business costs the most. You would think that government numbers could be used to make this assessment, but they are notoriously inaccurate. A Competitive Enterprise Institute study of the 53,838 federal rules finalized between 2001 and 2014 found that only 246 of them (less than 1%) quantified regulatory costs. Lurking in the other 53,592 are some very costly regulations to be discovered by some other method.
Instead, the CEA selected the top 21 regulations based on measures of attention from the public, as expressed by actions in Congress or comments submitted to the regulatory agency during the regulatory process. The CEA then performed a rigorous economic analysis of the selected regulations to estimate their costs and benefits. The arithmetic motivating this procedure is that a sum of the hundreds of costs savings (the entire deregulatory portfolio) is made up largely by the elements of the sum of cost savings from the regulations with the largest costs.
The attention metric led to some interesting discoveries. Take the 2016 prohibition of “junk” health insurance plans (i.e., plans that families like and purchase, in large part because the plans are cheaper than the plans endorsed by bureaucrats) that the Trump administration reversed in 2018. Whereas the typical regulation receives zero comments, this one received thousands. At the same time, the regulators assessed no cost for the rule because the rule was (with a bit of circularity) designated to be “economically insignificant.” Such designation is not supposed to be used unless there is no material adverse effect on a sector of the economy. It is absurd to deny any material adverse effect from a prohibition of a product that two million people would be purchasing (as estimated by the nonpartisan Congressional Budget Office). The CEA estimated that the annual cost of this regulation was $13 billion, which is 130 times the monetary threshold for “economic significance.”
It’s hard to understand the intention of the regulators who designated the rule to be “economically insignificant.” Were they unaware that the rule was getting thousands of comments? Did they think that people bothered to comment on something insignificant? Was it a technical error? Or was it a deliberate attempt to jam through a regulation without revealing much about its costs? Regardless of which answer is correct, we have yet another reason to doubt the cost estimates provided by regulatory agencies.
A similar phenomenon is revealed in the chart below, reproduced from another CEA report on prescription drug prices. It shows something historically unusual happening to prescription drug prices, as measured by the Consumer Price Index calculated by the Bureau of Labor Statistics. Much of the change has to do with deregulation of the entry of generic drugs. The Food and Drug Administration had such a burdensome approval process for generic manufacturers that in some instances only one company was making a generic. A handful of lucky, or well connected, companies were able to sell a drug they did not invent at a price about as high as that charged when the inventor held the monopoly. President Trump’s FDA changed that.


Figure 1 CPI for Prescription Drugs, Jan 1970 to Sep 2019. Source: CEA October 2019.
A little arithmetic helps to assess orders of magnitude (CEA calculations are much more detailed). If prescription drug prices had continued to increase at 4% per year after 2016, that would put them 8% higher after two years. In fact, after deregulation, they fell about 2% over two years, and therefore were roughly 10% below the previous trend. With the average household spending about $2,700 annually on prescriptions—including the taxes they pay to support government programs purchasing prescriptions—that is an annual savings of $270 per household.
These examples, repealing the costly regulation of generic drugs and health insurance, are but two of many such efforts by the Trump administration since 2017. This paragraph, from the CEA report’s conclusion, gives a sense for the broad swath of deregulation:
Since 2017, consumers and small businesses have been able to live and work with more choice and less Federal government interference. They can purchase health insurance in groups or as individuals without paying for categories of coverage that they do not want or need. Small businesses can design compensation packages that meet the needs of their employees, enter into a genuine franchise relationship with a larger corporation, or seek confidential professional advice on the organization of their workplaces. Consumers have a variety of choices as to less expensive wireless and wired Internet access. Small banks are no longer treated as “too big to fail” (they never were) and subject to the costly regulatory scrutiny that goes with that designation.
All told, the CEA report estimates that over the next five to 10 years, the deregulatory efforts of the Trump administration will increase annual real incomes in the United States by $3,100 per household. 
That’s no ditch. 


Wednesday, November 6, 2019

"They desperately tried to prevent the truth..."

"They desperately tried to prevent the truth about the Famine from reaching the ears of the higher ups."
Raleigh, Helen. Confucius Never Said (p. 25).


Raleigh and others have described the problems in Mao's China and Stalin's USSR with communication up the political hierarchy.  But of course for Americans that history is hardly relevant.  In the USA, truth reaches the higher ups because we have democracy, a free press, and modern technology.  And we don't have famines.

But we do have an opioid epidemic.  Below we see how it took almost 20 years for the U.S. government to pay attention, as measured by word frequencies ("opioid" or "opioids") in the Federal Register.


Only in 2017 did the opioid epidemic get as much attention as climate change.

Alternatively, we could look at the Congressional record, where the words "opioid" or "opioids" appeared exactly zero times as recently as 2014 (a year in which "climate change" appeared over 300 times).


Monday, October 28, 2019

Trump's economists will be missed

When the day comes (year 2029?) that a "progressive" Democrat occupies the White House, we can look with nostalgia on the good old days 2017ff when White House economists literally followed the textbook.

Surely the economists working for that new President will be no smarter than UC Berkeley's Emmanuel Saez.  In his primary defense of Medicare for All, Mr. Saez now writes that payments to private health insurance are "just like taxes."

Saez understands that those brainwashed by old school economics will be thinking "health insurance premiums [cannot be] a tax [because] people have some choice."  Their mistake, he says, is that unlike "spending on food and clothes," premiums for employer HI are "mandatory." (The equivalence of premium and tax is also a central premise of their new book, especially Chapter 5).

Mr. Saez is showing his ignorance about American law, and that he is too lazy to take even a cursory look at the data.

Regarding the law, no one is required to purchase health insurance.  Yes the Affordable Care Act requires either purchasing or paying a penalty, but the PENALTY IS ZERO and furthermore there are many loopholes built into the law.

As an empirical matter, more than half of American workers are NOT having health insurance taken out of their paycheck.  Even the Saez article admits that cash wages are higher compared to having HI taken taking out.  So those workers who pay health insurance through their paycheck have chosen not to have one of those tens of millions of jobs with higher cash pay but no health benefit.

Let's put this another way: Would Candidate Warren promise that American workers can have the same alternatives to paying payroll and income taxes that they currently have for having HI premiums taken out of their paychecks?  I didn't think so.

[There are many other problems with Saez' assertion, e.g., how a payroll tax as compared with HI premiums would vary with employment, income, hours, etc., but the above is enough to show how he is wrong on his own terms.]

Friday, October 25, 2019

Tragic consequences of cheap "meth": more meth consumption and more meth overdoses

The illegal drug meth has been getting a lot cheaper, due to technological "progress" in manufacturing.  I have been telling people this for a while and that the tragic consequence will be more overdoses, but most people are under the (false) impression that drug overdose reflect only deaths of despair rather than a movement along a stable meth-demand curve as a result of increased supply.


Now the evidence of additional meth-involved overdoses is coming in.

See also the 2019 CEA report on the role of prices in drug overdoses.