Saturday, December 15, 2012

Sales Taxes: Incidence and Incentives

It is commonly said that the sales tax affects workers and non-workers alike, as opposed to payroll and income taxes which tend to fall on wage earners, because everybody buys things but not everyone workers.  The elderly, for example, are harmed more by a sales tax than by a wage tax.

There is some truth to this conventional wisdom, but it has been exaggerated because many income streams are automatically indexed to inflation (specifically, the CPI), and CPI inflation reflects sales taxes.  For example, UK unemployment benefits are indexed to the CPI.  When the UK increased its VAT, inflation was created and the unemployed automatically got a raise while workers did not.

Another example, US social security benefits are indexed to the CPI via the Cost of Living Adjustment.  Thus, if the U.S. were to implement a VAT, the CPI would go up and the elderly would automatically get a raise.  Workers would not.

On the other hand, newly retired people have their social security benefit indexed to wages, which would not automatically increase after a VAT.  So new retirees would, in effect, pay the VAT throughout their retirement.  Elderly people also have non-social-security income sources, which are sometimes not indexed to inflation.  To the extend that elderly relied on non-indexed income, they would pay part of the VAT too.

In terms of incentives, the VAT discourages work because people work in order to buy more.  But, as noted above, there is an addition work-discouraging effect of sales taxes: through CPI-indexation it reduces the income gap between workers and non-workers.

Friday, December 14, 2012

Did Poverty Rise or Fall?

Adjusted for taxes and benefits.

Aloc Sherman says it was constant.

Jared Bernstein says America had “the deepest recession since the Great Depression and poverty didn’t go up.”

Shawn Fremstad says says "Social insurance and the Obama Stimulus, limited as it was, have and continue to play a fundamentally important role in limiting the damage. But even taking that into account, real poverty really did rise during the recent recession."

Contrary to Mr. Fremstad's claims, my post on this matter clearly explains that I do not have my own estimate and that "The measurement of poverty and its trends is an important and continuing research area, and future research could suggest that the poverty rate had increased."   Perhaps Sherman and Bernstein are wrong. Perhaps they are right. Maybe what Mr. Fremstad really advises is not to rely on Sherman and Bernstein.

Thursday, December 13, 2012

The Microeconomics of Poverty since 2007

Copyright, The New York Times Company

Government safety net programs were put on steroids by the 2009 stimulus law, erasing incentives for a significant fraction of the unemployed.

Last week I noted that poverty, when measured to include taxes and government benefits, did not rise from 2007 to 2011. That result, I contended, indicated that people in the neighborhood of the poverty line faced marginal tax rates of about 100 percent. I also noted that 100 percent marginal tax rates were excessive.

These three statements generated many angry comments, so it’s worth examining them in more detail.

One possibility is that the poverty rate did rise significantly, even when adjusted to reflect taxes and government benefits. That possibility would contradict Jared Bernstein’s work in this area, because he concluded that America had “the deepest recession since the Great Depression and poverty didn’t go up.” It would also contradict Arloc Sherman’s findings that the poverty rate was essentially unchanged (thanks to generous new subsidies).

The measurement of poverty and its trends is an important and continuing research area, and future research could suggest that the poverty rate had increased. However, future research could also point in the other direction.

In 1995, a panel established by the National Research Council to evaluate poverty measurement concluded that it might make sense to recognize not only the monetary resources available to families, but also the amount of free time they had. After 2007, many people found themselves with less pretax income and more free time because they had lost their jobs. Because the official poverty measures consider only the pretax income, adjusting poverty measures to reflect free time would cause the poverty rate to fall more, or increase less, after 2007.

Assuming for the moment that Mr. Bernstein and Mr. Sherman are right about the poverty changes, a second possibility is that poverty failed to rise even while marginal tax rates were significantly less than 100 percent. As one blogger put it, “Just because poverty rates didn’t rise doesn’t mean that the government imposed a 100 percent implicit tax rate.”

One might wonder exactly how, in theory, poverty rates remained fixed when millions of people lost their jobs, and when the government did not essentially replace all the disposable income lost because of layoffs. The magnitude of marginal tax rates imposed by the government is ultimately an empirical question, though. As far as I know, none of my detractors have offered any estimates.

I have been examining marginal tax rates under the American Recovery and Reinvestment Act of 2009, especially as experienced by families near the poverty line. The chart below shows some of my results pertinent to Mr. Bernstein’s poverty measures.

The chart examines households that in 2007 had household income of less than 175 percent of the poverty line and were therefore at risk of falling into poverty if they were later laid off from their job. The chart organizes unemployed heads and spouses in terms of their marginal tax or “job acceptance penalty” rate. With that rate, I mean the fraction of a person’s employee compensation that goes to federal, state and local government treasuries or to expenses associated with commuting to work (I assume that is $5 for each one-way trip) as a consequence of working full time at the same wage as before layoff rather than remaining unemployed. (The remainder of the worker’s compensation, if any, is left to enhance the disposable income of the worker and the worker’s family.)

The chart also organizes unemployed people in terms of what they earned weekly before layoff, with special attention to the group in the $250 to $349 range, which is near the weekly earnings of a full-time minimum-wage job.

Among the unemployed who had earned near minimum wage (shown in red in the chart), a majority had a job-acceptance penalty rate of at least 100 percent, meaning that accepting a job with the same pretax pay as they had before layoff would not increase their disposable income. If they were to accept such a job, all the compensation would go to the Treasury in additional personal income taxes, additional payroll taxes and reduced unemployment insurance benefits (under the stimulus, unemployment insurance benefits alone were more than half of the pretax pay from the previous job), and in some cases reduced benefits from the Supplemental Nutrition Assistance Program, known as SNAP, and Medicaid.

Only 18 percent of those earning near minimum wage had a job-acceptance penalty rate of less than 80 percent.

My results consider the unemployment insurance program and its federal additional compensation and subsidies for Cobra, which gives workers who have lost their jobs the right to purchase group health insurance for a limited period of time; SNAP; Medicaid; the regular personal income tax (both federal and state); the earned-income tax credit, the child tax credit, the additional child tax credit and the “making work pay” tax credit.

Job-acceptance penalty rates of 100 percent or more are probably more prevalent than shown in the chart because I did not include child care costs among employment expenses and did not include programs like disability insurance, Temporary Assistance for Needy Families and Supplemental Security Income, means-tested housing subsidies, means-tested tuition assistance, means-tested energy-assistance programs and other programs that impose positive implicit marginal tax rates.

I agree with Mr. Bernstein that government policy, especially the 2009 stimulus law, is responsible for preventing a rise in the poverty rate. But it achieved that end by erasing incentives for a significant fraction of the unemployed.

Thursday, December 6, 2012

The ARRA: Some Unpleasant Welfare Arithmetic


Food stamps, unemployment insurance, and other subsidies to persons who are unemployed and otherwise with low incomes, have recently been made more generous and available in more situations.  Did extra transfers help prevent a deeper recession, or did it amplify and prolong it?  Economists cannot fully answer these questions without examining the incentives of persons receiving the transfers.  The purpose of this paper is to quantify the number of people who recently had essentially no short-term financial reward from working, and how that number might have been different if safety net program rules had been made more generous, or if they had remained what they were in 2007.
American economists often discuss the unemployment insurance (hereafter, UI) system and its moral hazards as if the penalty for accepting a new job were about 50 percent of compensation,[1] which would suggest that the financial reward to working would be positive and significant in all but a few rare circumstances.  At the same time it is commonly noted that the average weekly unemployment benefit of about $300 barely exceeds the compensation from a full-time minimum wage job, and for this reason alone UI is almost always inferior to a real paycheck.  These claims are incorrect because they ignore payroll taxes, income taxes, and other safety net programs.  The tax arithmetic suggests that many UI participants would, even under 2007 rules and even ignoring all safety net programs aside from UI and the personal income tax, keep about 30 percent – and maybe as little as ten percent – of the compensation generated by accepting a new above-minimum-wage job because taxes typically took as much of the reward from working as foregone unemployment benefits did.  These thin margins essentially disappeared under the American Recovery and Reinvestment Act of 2009 (hereafter, ARRA).
Even when helping the poor is a primary policy motivation and the wage elasticity of labor supply is low, optimal tax theory frowns on labor income tax rates that equal or exceed one hundred percent (as long as work is not socially harmful) because at a one hundred percent rate there is no longer a tradeoff between efficiency and government revenue.  From a positive point of view, economists expect that employment rates will be low, if not zero, in groups of people who are aware that they receive no financial reward from working.  These are a couple of more reasons to quantify the prevalence of marginal tax rates that are near or exceed one hundred percent.[2]
The paper begins with a brief overview of the major safety net programs affecting the financial reward to working.  The first quantitative results are 2009 marginal tax rates and their components for some of the more common tax situations encountered by American workers and their families.  The rates are calculated for three scenarios: actual benefit and tax rules, benefit and tax rules as they would have been if they had not been changed since 2007, and benefit and tax rules as they might have been in a bigger stimulus.  The following section considers the rich and complicated variety of possible tax situations in order to arrive at estimates of the number of household heads and spouses with little or no financial reward to accepting a new job.  A “demand shocks and job search gambles” section shows how job acceptance rewards are nonlinear in the amount of a job offer, and the final section concludes.

Conclusions

            Before the recession began, going from unemployment back to work did not pay that well for someone eligible for unemployment benefits, but almost always paid a little something, with at least twenty percent of compensation from a job going toward enhancing the new employee’s disposable income above what it was during the spell.  Despite its inclusion of a “making work pay” tax credit and its expansion of the “earned income tax credit,” the ARRA increased marginal tax or “job acceptance penalty” rates for the vast majority of the unemployed and essentially erased the short-term financial benefits from working for two to three million non-elderly and unemployed household heads and spouses.  About five million had their job acceptance penalty rates increased above 80 percent by the ARRA.
Layoffs have also long been subsidized by unemployment insurance and other safety net programs, but again typically public treasuries would pay for less than 90 percent of the compensation lost from a layoff, while employer and employee had to absorb the rest.  When the ARRA was in full force, over three million workers could be laid off with a subsidy of 90 percent or more, and another five million with a subsidy rate of 80 to 89 percent.  A bigger stimulus would have put as many as 30 million workers in that situation.
To the degree that unemployment responds to the financial incentives for working, the ARRA and other programs assisting the unemployed interact with demand shocks in determining the number unemployed: an adverse demand shock increases unemployment more under the ARRA than it would if the same demand shock were experienced under 2007 tax and subsidy rules.
None of these results hinge on the increase of the duration of unemployment benefits from 26 to 99 weeks, which was achieved by legislation separate from the ARRA (United States Department of Labor 2011).  I count each unemployed person only when they are laid off; the results here reflect the level of benefits delivered by tax and subsidy programs to unemployed persons beginning to receive UI.  UI and other program eligibility rule changes are not considered in this paper but are important for quantifying changes in marginal tax rates between 2007 and 2009, and comparing such changes across demographic groups.
My findings of large, even confiscatory, job acceptance penalty rates are not the result of “cliffs” in transfer program formulas in which many dollars of benefits are lost for earning a particular marginal dollar (Yelowitz 1995) because I look at the consequence of more “discrete” decisions of accepting a job, or initiating a layoff, that change calendar year income by thousands of dollars.  Instead, my large rates reflect the combination of tax and subsidy rules, especially unemployment insurance.  Not surprisingly, my rate estimates exceed those of previous studies of transfer program marginal tax rates that omit unemployment insurance (Holt and Romich 2007) and exceed those of previous studies of unemployment insurance that ignored taxes (Chetty 2008).  But taxes, unemployment insurance, and other transfer programs have recently contributed significantly to the living standards of the poor and unemployed (Sherman 2011), so we cannot have a full understanding of the magnitude of marginal tax rates without considering the safety net broadly.
I have likely somewhat under-estimated the number of people with marginal tax rates in excess of one hundred percent because I have omitted a number of other possible sources of implicit taxes.  They include other means-tested cash assistance programs such as Disability Insurance, TANF and Supplemental Security Income; means-tested housing subsidies; means-tested tuition assistance; and means-tested energy assistance programs.  They also include court-enforced wage garnishment associated with the collection of delinquent consumer, tax, and child support debts.
            At the same time that incentives to retain and accept jobs were erased for millions, millions were laid off from their jobs and remained unemployed for an extended duration.  I estimate that 2.3 million additional non-elderly household heads and spouses were laid off in 2009 than would have been laid off if the 2000-2007 average number of layoffs had persisted through 2009.  The number of unemployed household heads and spouses were about 5 million greater than normal.  In other words, the extraordinary numbers of persons laid off and unemployed are of roughly the same magnitude as the numbers of persons having their incentives essentially erased by the ARRA.  The fact that more persons would have had incentives erased if the ARRA had been more generous to the unemployed suggests that it is possible that a bigger stimulus would have resulted in more unemployment than the actual stimulus did.
            It is beyond the scope of this paper to quantify the impacts that the large penalties for work from the ARRA (or other legislation) had on the labor market for people laid off during the recent recession.  Nor do I attempt to determine whether increasing marginal tax rates beyond 100 percent matters more or less than increasing them beyond, say, 70 percent.  But even before obtaining such estimates we should not expect that a labor market would function normally while the private benefit to working was zero or negative.  For this reason, the arithmetic presented in this paper is indeed unpleasant, and disturbingly similar to discredited welfare program rules of the distant past.  As James Tobin put it in 1965,
“[A 100 percent tax rate] does just that, causing needless waste and demoralization.  This application of the means test is bad economics as well as bad sociology.  It is almost as if our present programs of public assistance had been consciously contrived to perpetuate the conditions they are supposed to alleviate.” (Tobin 1965, 890)


[1] Chetty (2008) estimates the U.S. UI replacement rate as 50 percent for the purposes of demonstrating that it might be slightly less than optimal.  See also Fujita (2010).
[2] Behavior in the neighborhood of 100 percent tax rates would be especially interesting if it were true that (a) when tax rates are lower and more typical of their historical values, the amount of unemployment were insensitive to the amount of the UI benefits and (b) unemployment would be high if unemployment paid better than working.  To see this, try drawing a graph of the relationship between unemployment and the size of UI benefits that satisfies the properties (a) and (b): it must turn or jump sharply toward high unemployment as the benefit approaches the amount of pay from working.

Wednesday, December 5, 2012

Poverty Should Have Risen

Copyright, The New York Times Company

When measured to include taxes and government benefits, poverty did not rise between 2007 and 2011, and that shows why government policy is seriously off track.

When somebody earns, say, $10,000 by working, he should keep some of it for himself and his family rather than handing it all over to the government. By the same reasoning, when someone loses $10,000 by not working, he should get some help from the government or from others in the forms of reduced taxes and enhanced benefits but still should bear a portion of that loss himself.

Economists debate the fraction of wages that workers should keep for themselves, because the optimal fraction is a trade-off between incentives, insurance, support of public goods, freedom and other factors. Libertarians and other believers in small governments might set the fraction at 80 percent or more. Other economists think that incentives have an effect on behavior, but incentive effects are small, so we can safely set the fraction at 30 percent, or even a bit less.

But I thought economists agreed that the fraction should not be zero, so that people losing money by not working would bear a portion of the loss. If people with declining incomes found them entirely replaced by government help, that amounts to 100 percent taxation (providing more benefits as income falls is sometimes called “implicit taxation”).

As James Tobin, a John F. Kennedy adviser, Nobel laureate and leading Keynesian economist of his day, said in a 1965 article, a 100 percent tax rate causes “needless waste and demoralization,” adding:

This application of the means test is bad economics as well as bad sociology. It is almost as if our present programs of public assistance had been consciously contrived to perpetuate the conditions they are supposed to alleviate.

Professor Tobin called the 100 percent tax situation demoralizing because the affected people find that all of the benefits of their hard work and success go to the government in the form of more tax receipts and fewer benefit payments. The unintended result would be less work and more families earning less than the poverty line, which is why Professor Tobin described such policies as perpetuating poverty.

If, as economists recommend, everybody’s tax rate is effectively less than 100 percent, then someone with disposable income of, say, 110 percent of the poverty line should find himself falling into poverty when he loses his job. His living standards would not fall to zero because he should be getting some help in terms of reduced taxes and increased benefits. But optimally his disposable income would fall to 80 percent of the poverty line, and perhaps below, until he found a new job.

Under the Obama administration, workers with disposable income in the neighborhood of the poverty line did not, on average, see their job losses during the recession translate into significant reductions in their disposable income.

As Jared Bernstein put it, America had “the deepest recession since the Great Depression and poverty didn’t go up.” He shows that the percentage of people in households with disposable income less than the poverty line was 15 percent in 2011, just as it was in 2007 before the recession began. In fact, the percentage fell a bit after 2008 when the stimulus law went into effect.

The results suggest that the government was helping too much. If they had been following the advice of Professor Tobin and all other economists who say they believe that tax rates should be less than 100 percent, the fraction of households with disposable income below the poverty line would have risen as a consequence of millions of lost jobs, just less than it would have without any government help.

Mr. Bernstein, one of the Obama administration advisers who designed the stimulus law and said it would quickly push the unemployment rate below 8 percent, appears to be unaware that it is possible for the government to help too much by creating the kind of situation Professor Tobin described and depress the economy in the process. Mr. Bernstein fails to mention incentives in any way and instead describes the poverty results as “a real accomplishment and a sign of a far more civilized society.”

Erasing incentives is not the way to a civilized society but rather to an impoverished one.


Sunday, December 2, 2012

Why Doesn't Poverty Rise During a Deep Recession?

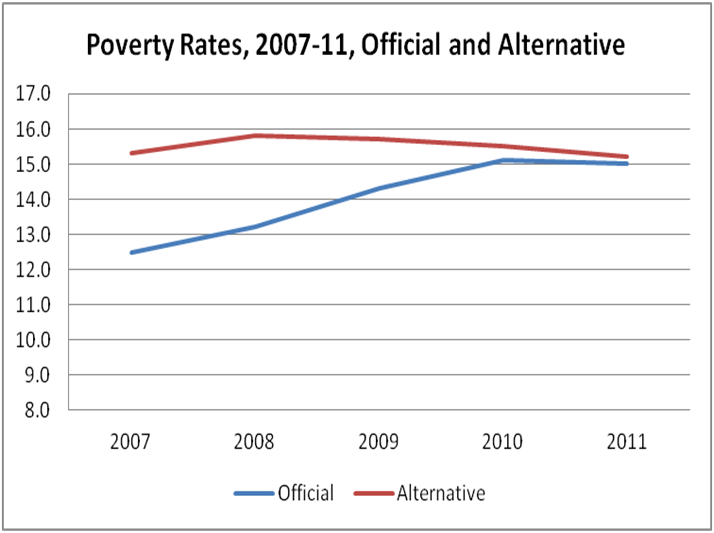
Because government benefits replace almost every dollar that people (in the neighborhood of the poverty line, at least) lost in the labor market. That's a 100 percent tax -- for every dollar a person earns (loses) he loses (gains) a dollar in government benefits, respectively.

Jared Bernstein presents the facts, especially this chart.


The official measure is cash income, and the alternative measure adjusts the official measure for all of the government taxes and benefits people pay or receive.

Bernstein thinks that the government has done well here, when it fact this reveals how excessive the benefits are.


Redistribution Recession Episode of the Robert Wenzel Show


I jump the video ahead to the 8:38 mark because it consists of a full 8 minutes digression on the month-to-month time path of the money supply during 2008.  Rewind if you want to hear that part.

Saturday, December 1, 2012

Why Doesn't UI Stimulate? 7 Min Podcast

WLS AM Don Wade and Roma 7 min podcast

Highlights
  • Law of Unintended Consequences
  • 99 weeks of UI is only one of many program expansions
  • The labor market is not a zero sum game