Showing posts with label economic outlook. Show all posts

Monday, June 27, 2022

The Hidden Increase in Capital Taxation

The taxation of business income is now increasing significantly, without any action from Congress.  The increase can be understood as two forces acting through one simple formula.

For tax purposes, depreciation is a statutory time path of deductions from a business' taxable income for each dollar invested in a real asset.  The path is called "depreciation" because the undiscounted present value of that time path is equal to one.  That is, 100 percent of every dollar invested will someday be available as a deduction.

One simple formula representing two shocks: D/(D+R)

An important reason that business-income taxation distorts investment is that business owners  evaluate time paths at a discount rate R > 0.  Therefore, in present value, only a fraction (z, in the usual notation) of investment is deductible from taxable income.

With constant depreciation (D) and discount (R) rates, z = D/(D+R) <= 1.  This simple formula captures two things going on right now in the U.S.: the sunsetting of TCJA's bonus depreciation and inflation.  (The former is specific to the U.S. but the latter is relevant for those nations that also tax business income while allowing depreciation deductions).

TCJA allowed the expensing of some investment, which makes z = 1 (think of expensing either as R = 0 or infinite D).  Expiration of expensing pushes z below one.

The depreciation schedule is a nominal time path; depreciation allowances are not indexed for inflation.  Therefore the appropriate discount rate R is a nominal interest rate.  Clearly nominal interest rates have increased over the past year and a half (inflation!), which reduces z in all but the expensing case.  Indeed we can ignore the expensing case if we take the sunsetting first and then add in inflation.

Quantitative results

In order to translate reductions in z into increases in the effective real price of investment, I use a special case of the Hall-Jorgenson formula, where the pre-tax real price is inflated by the tax factor (1-tz)/(1-t) <= 1, were t is the statutory rate of taxation of business income (Cohen, Hassett, and Hubbard consider the more realistic, but also more complicated, cases).  The equality holds only when z = 1 (i.e., expensing).

The chart below shows the relation between the nominal interest rate R and the tax factor.  We start close to the origin with low inflation and bonus depreciation.  Sunsetting by itself moves off the origin to (pre-inflation) R of, say, 2-3%/yr.  That is about a 7 percent increase in the real price of investment.


Next inflation increases R.  So far annualized R appears to have increased about 2 percentage points although there are concerns that it could increase more (presumably it would increase close to 1-for-1 with inflation if inflation were expected to be permanent).  That increases the real price of investment another 4 percent or so.

Inflation further increases the real price of investment due to personal income taxation, especially to the extent that personal income is taxed at higher personal rates than business income is.  On the other hand, the sunsetting of expensing is not relevant for structures because they did not get bonus depreciation.  So perhaps all three effects combined increase the price of investment 15 percent, with about half specific to TCJA.

Oil and gas

Oil and gas extraction is particularly capital intensive.  Using a capital share of 71 percent, that suggests an 11 percent shift (upward) in the marginal cost for that industry, with about half due to TCJA subset and therefore not shared by foreign producers of oil and gas.

Comparing the period of the Biden presidency (Feb 2021 - Feb 2022, which is latest available) to 2018-19, inflation-adjusted world oil prices have increased 20-25 percent while US O&G industry marginal cost has shifted up 11 percent.  That by itself would blunt much of the supply response.  Then add:

  • new threats of federal energy and banking regulation,
  • threats to increase the statutory rate on business income, and
  • the effects of ESG investing that increasingly stigmatizes investment in fossil fuels,
and it should be no surprise that U.S. supply hardly responded in 2021 to high oil prices while suppliers in Canada, Russia, China, Norway, and even OPEC did.

Thursday, June 16, 2022

Recession Time? Don’t Act Surprised

Treasury Secretary Yellen does not see any indicator of an imminent recession.  She isn’t looking.  The normal economic tailwinds have calmed and, as predicted, Biden's economic policies are a significant headwind.

A recession is sometimes defined as a reduction in the number employed nationally for a couple of months.  Other times it is defined as a reduction in real GDP for two quarters or more.

When it comes to predicting events like this, my recursive approach is to first understand where the general trends are heading.  In technical terms, is the economy’s “steady state” above or below where we are now, and how much?  If the trends are strong up, small perturbations around that trend will not make a recession.  If the trends are flat, then even a small negative shock will create a recession by one or more of the definitions.  Which definition will be triggered can be assessed by contrasting employment trends with productivity trends.

Four important trends are worth considering: organic productivity growth, organic population growth, recovery from the pandemic recession, and new public policies affecting productivity,  population, or employment.

Organic trends

Given that recessions are defined in absolute rather than per capita terms, population growth is normally an economic tailwind.  However, annual adult population has fallen from a bit above one percent 1980-2018 to about 0.4 percent.  Illegal immigration is a wild card here because we do not know how many are immigrating, what fraction are adults, and whether and how those adults will be economically engaged.  With that caveat, we now are in a situation where even a small negative shock that would not have caused a recession in the one-percent population growth era will now.

Recovery from the pandemic was also a tailwind.  It someday will continue to lift employment, but at the moment it looks like employment has recovered as much as it can given the serious health problems encountered during the pandemic, including but not limited to self-destructive substance abuse habits that are not complementary with productive employment.  Some of these people will show up on payrolls but how reliably they show up for work is another question.  Diabetes, liver disease and heart disease have gotten out of control since 2020.

Workers lost skills and capital laid idle during the pandemic.  These are recovering, although their recovery will not be fully recognized in the growth data.  GDP and productivity levels were exaggerated during the pandemic as many goods were unavailable or low quality in ways not captured by the national accountants.  For example, public school teachers stayed home from school but the national accountants assumed that they were as productive as ever merely because they continued to get paid.  As they get back to traditional teaching, this will not be officially recognized as economic progress for the same reason the pandemic regress was never acknowledged. 

Crime has gotten bad, especially in big cities where productivity is normally the highest.  Consumers and businesses are avoiding big cities, which is a cost (“excess burden”) beyond the crime statistics because the whole point of the avoidance behaviors is to keep from being one of those statistics.

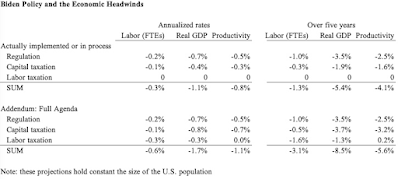
Fitzgerald, Hassett, and I predicted in 2020 that Biden’s economic agenda would reduce the levels of full-time equivalent employment per capita by 3.1 percent and real gdp per capita by 8.5 percent.  If that level effect were spread over five years, that would be 0.6 percent per year and 1.7 percent per year, respectively, as shown in the Table as an addendum panel.  That by itself makes a recession likely in one of those five years.

Regulatory Policy

Our analysis of Biden’s agenda distinguished regulation from capital taxation from labor taxation.  His regulatory agenda seems to be going ahead as we expected.  The good news is that Biden’s nomination of David Weil to the Department of Labor was rejected by the Senate and Biden was slow to fully mismanage the National Labor Relations Board.  But we did not anticipate that Biden’s DOL would disrupt labor markets as much as it did with its mask mandates.  Sticking with our original estimate, it looks that Biden’s regulatory agenda is reducing employment by 0.2 percent per year (of five years) and real GDP by 0.7 percent per year below the organic trends.  See the Table’s top panel.


Of particular concern over the next few months is the reliability of the electric grid and air travel.  Snafus of this type are already built into our regulatory analysis but these examples put more texture on the economic reasoning that links the marginal regulations with poor economic performance.

Capital Taxation: Inflation Sneaks In

Biden’s Build Back Better bill would implement much of the capital taxation we envisioned in 2020.  The good news is that the bill has not yet passed, and passage of its capital tax elements are not imminent in some other form.  The bad news is that inflation is taxing businesses without any Congressional action (recall Feldstein and more recently Hassett on the effect of inflation on the cost of capital), while it appears that Biden will let temporary provisions in the 2017 TCJA expire.  With capital taxation during the Biden administration increasing about half of what we expected, it would reduce real GDP by about 0.4 percent per year over five years.

Speaking of inflation, higher Fed Funds rates are already showing up in mortgage rates.  In effect, the Federal Reserve is introducing a tax (or cutting a subsidy) on structures investment, which is likely to send at least that sector into a recession.  Socially responsible (a.k.a., woke) investing is also skewing the allocation of capital.

Combining capital taxation and regulation, the headwinds in the Biden economy are 0.25 percent per year for employment and 1.1 percent per year for real GDP.

Labor Taxation: Direction Unclear

Labor taxation is an interesting wild card here.  Marginal tax rates on work were cut sharply when the $300 weekly unemployment bonus expired last summer.  That effect has played out already.  But I expect that Congressional Democrats, and even some Republicans, will expand unemployment benefits if anything resembling a recession were occurring.  That could easily and quickly reduce employment by one percent, if not more.  On the other hand, various federal health insurance subsidies are about to expire.  If they do (without resurrection), that will encourage work.

Bottom Line

Overall, a recession is highly likely with so many headwinds and so few tailwinds.  A recession is more likely by the GDP definition than the employment definition.  The depth of the recession depends on how much Congress destabilizes things by further adding to the already large federal portfolio of programs for the unemployed and poor and further adding to tax burdens.


Monday, April 20, 2020

30+ million out of a job

A one-size-fits-all policy, even at the state level, has been a mistake from the beginning.  Instead policy should be favoring decentralized mechanisms over direct control and ensuring that the chosen regulations deliver more net benefits than less stringent alternatives.  It is too bad that governments are causing so much harm at this critical moment by ignoring these longstanding principles of government regulation.

Expressed at an annual rate, the shutdown is already costing $7 trillion, or about $15,000 per household per quarter.  Employment had already fallen 28 million by April 1 and continues to fall as the shutdown continues.  Not only is the shutdown costly, but it is a cost-ineffective way of reducing the health harms from the virus.  My recommendation is to achieve close to, but somewhat less, of the mortality reduction at dramatically less cost to hundreds of millions of workers, consumers, and business owners.

Here's why I think at least 30 million are out of work as of today.  First, that's where I expected we would be headed based on the fact that workdays as we know them have been eliminated.  Second, as of the week of March 29-April 4 (hereafter "April 1"), the employment rate of persons aged 18-64 fell from 0.738 to 0.607.  Assuming conservatively that the same percentage decline (17.8%) also applied to persons 16, 17, or 65+ years old, the decline is 28 million people as of April 1.

There is no reason to believe that the decline (an average of 1.3 percent per day for two weeks) was finished by April 1.  The stay at home order for Texas and Maine was not until April 2.  FL, GA, MS: April 3.  AL: April 4.  MO: April 6.  SC: April 7.  Even if the decline were only 0.2 percent per day over the two weeks beginning April 5, that would put the cumulative employment decline past 30 million.


Friday, April 17, 2020

Shutdown reduces the flow of GDP by 28 percent

New data from Alexander Bick and Adam Blandin suggest that the flow of real GDP is 28 percent less than it would be under normal circumstances.  Using two entirely different methods, I previously forecasted 25 percent and 26 percent.  Below are the details of my calculations from Bick and Blandin.

Bick and Blandin (2020) find that working hours per working age adult circa April 1 declined 27 percent from February.  Moreover, among those working in February 2020, between 59 and 61 percent are now absent from their workplaces either due to not working or working at home.  If half of the capital in those workplaces is idle and not replaced by utilizing capital located in home offices, then capital utilization has fallen by 30 percent and GDP by 28 percent.

The GDP calculation assumes production-function exponents of 0.3 and 0.7, respectively.

This brings my estimate of the welfare cost of shutdown, relative to a normally functioning economy, of $7.1 trillion per year or $233 per household per workday.  For this purpose I use the average GDP estimate from the "input method" cited above and the output method I used earlier.


Monday, March 30, 2020

An example of 7(a) perversion

Let's say that you have 700 employees in the prior year, earning an average of $50K.

If you continue that between now and the end of Q2, Title I of the 2020 CARES Act will give you nothing.

BUT if you fire at last 201 of those employees, and THEN apply for a $10 million 7(a) loan, the entire $10 million will be forgiven at the end of Q2 as long as you keep enough of the 499 employees that remain.  Moreover, you pay no business tax on the forgiven amount.

You are eligible for the $10 million loan because your prior year payroll was over $10 million.  You are eligible for $10 million forgiveness because your payroll still exceeds $10 million.

In effect, the Federal government has paid you $50K per employee, tax free, to fire people pursuant to a provision called "KEEPING AMERICAN WORKERS PAID AND EMPLOYED ACT."

The SBA could fix this problem when it issues guidance around the CARES Act by setting a time frame sufficiently far in the past that it cannot be manipulated.

Sunday, March 29, 2020

Notes on 2020 CARES Act, in reading order


Note that this law is just one of multiple new COVID-19 relief laws.  These are my notes on the labor market provisions in the law, which are all of Titles I and II, and parts of Title III.

Title I KEEPING AMERICAN WORKERS PAID AND EMPLOYED ACT
  • A.k.a., 7(a) loans
  • "Loans" to small businesses that maintain their payrolls
    • Payroll does not include any payments to employees making $100K+ annually
  • The loan amount is capped by the prorated amount of payroll for the prior year
  • The loans can be forgiven in whole or part
    • The forgiveness is capped by the minimum of
      • $10 million;
      • the sum of ongoing payroll, rent, utilities, interest;
      • the loan amount (itself capped at 2.5 times average monthly in the prior year).
    • The forgiveness is free from business tax.
  • For this act, a small business is less than 500 employees.
    • The date of this determination is crucial.  If the SBA Administrator is not careful with its guidance, it could be interpreted as the date of the loan.
    • For businesses with more than 500 employees, this act would be a MASSIVE SUBSIDY TO FIRING enough people to be at 499 or less before making the loan application.
      • Firing employees making more than 100K is most advantageous under this title.
      • The SBA Administrator's definition will also affect expectations about how extensions of this Title will be implemented.
    • Another part of this law will pay the fired employees, perhaps more than they were making as workers.
    • Nonprofits are eligible too.
  • Ends June 30, 2020
    • Businesses with significantly less than 500 employees have a zero marginal cost of adding employees.  However, June 30 is too soon to make much profit from hiring.
Title II
  • Section 2102.  PANDEMIC UNEMPLOYMENT ASSISTANCE
    • A new program making payments to unemployed not covered by traditional unemployment assistance, such as someone who
      • quit their job, or
      • has no work experience.
    • This program expands the UI-eligible pool by a factor of at least six.
      • Normal pool is a subset of persons laid off from work, which should be less than 20 million.
      • With Section 2102, the pool is any adult not on a full time payroll, which is at least 128 million (259 million adults minus Feb 2020 full-time employment of 131 million). 
      • See Section 2104 below ("$1000 a week") and then calculate what the Treasury would spend on that section if, say, 80 million people were collecting $1000 per week.
    • Program lasts through Dec 31.
    • Weekly benefits last 39 weeks plus the duration of any extension of traditional UI.
    • If a state were to deny UI benefits to a person failing a drug test, this program would pay them full benefits at Federal expense!
  • Section 2103.  EMERGENCY UNEMPLOYMENT RELIEF FOR GOVERNMENTAL ENTITIES AND NONPROFIT ORGANIZATIONS.
    • The Federal government takes over the UI "contributions" of government and nonprofit employers through Dec 31.
      • Background: Normally, all employers make contributions that partially reflects their history of layoffs.  In effect, part of a UI benefit is paid by the employer who fired the person.  This is a normally a tax on making layoffs.
    • By eliminating such contributions, the new program is a SUBSIDY FOR LAYOFFS by government and nonprofit employers
  • Section 2104.  $1000 a week!
    • Not to be outdone by the 2009 "stimulus" law, which paid a $25 weekly bonus to UI recipients, the 2020 EUC program pays a $600 weekly bonus!
    • This bonus goes on top of the normal UI benefit, which averaged $378 per week at the end of 2019.  i.e., get paid $1000 per week for NOT WORKING!!
    • It lasts through the end of July.
    • $1000 per week is more than most full-time workers get paid for working.
    • This disincentive to work and subsidy for layoffs is massive and not even close to any historical precedent.
  • Section 2105.  Federal financing of the first week of unemployment.
    • As with Section 2103, this is a subsidy for layoffs but for all employers.
    • In contrast to Section 2103, this section only pays for one week.
  • Section 2106.  Clean up of the previous coronavirus law.
  • Section 2107.  Pandemic EUC
    • Like the 2009 EUC program, this EUC programs provides Federal money to continuing paying UI benefits after state benefits have been exhausted.  It is limited to 13 weeks, putting the total duration of UI benefits at 52 weeks.
    • Beneficiaries have to be actively seeking work.
      • This will means some VERY long lines to apply for jobs, because standing in such line is both (i) proof of actively seeking and (ii) pretty safe protection against a job offer that would end UI.
    • It lasts through the end of the year.
  • Sections 2108-2110.  Part-time UI (a.k.a., "work share")
    • Pays Federal benefits to part-time workers whose hours were reduced from full time.
    • It lasts through the end of the year.
    • Take a worker earning $800 per week full time.  With the CARES Act, the employer has two more options
      • Lay her off so she can get $1000 per week from UI.
      • Change her to half time so she can get $400 per week from the company plus another $500 week from UI, for a total of $900 per week.
  • Section 2301.  Employee retention tax credit.
    • Businesses with 0-100 full-time employees
      • Section 2301 is a 50 percent tax credit for wages paid to any employee.
    • Businesses with 101+ full-time employees
      • Section 2301 is a 50 percent tax credit for wages paid to employees on the payroll but not at work due to COVID-19.
      • For these employers, Section 2301 is a tax on work because employer has full payroll tax only when the employee works (as opposed to being on the payroll).
    • Regardless of size, the employer must have gross receipts that are sufficiently low compared to the previous year.
    • The credit applies to wages paid through the end of the calendar year, and cannot exceed $5000 per employee.
    • These credits are fully refundable and administered through the payroll tax.  Nonprofits can get them too.
    • Regardless of business size, Section 2301 is a step-function sales tax.  i.e., as soon as sales exceed a threshold, the payroll tax jumps discretely.
  • Sections 2303-4.  Symmetric treatment of business gains and losses.
    • Background: As an business' net income changes sign from year to year, so does her after-tax cost of payroll because the deduction of payroll from business income has tax value only in years with positive net income (subject to some complicated carry forward and backward provisions).  This normally gives employers an extra incentive to stop paying workers during a loss year.
    • These sections by themselves, increase the incentive to have payroll during a year with negative net income, which 2020 will be for many businesses.  I don't think the sections have much effect on the incentive to have the employees actually work (as opposed to be paid without working).
    • These sections also open the door to Treasury losses due to clever tax accounting, which is why gains and losses are historically treated asymmetrically.
Title III forthcoming


Monday, January 9, 2017

Labor-market growth turns negative, with many coincidences

Below is an index of hours worked per person, which reflects both the amount of employment and the number of hours that employees work up through Dec 2016. It shot up when the Emergency Unemployment Assistance program was finally canceled. Its growth was especially slow when the new health care law began to penalize employers. Over the most recent twelve months, the trend is (infinitesimally) negative.


Friday, November 4, 2016

Slow growth coincident with Obamacare

Below is an index of hours worked per person, which reflects both the amount of employment and the number of hours that employees work up through Oct 2016. It shot up when the Emergency Unemployment Assistance program was finally canceled. Its growth was especially slow when the new health care law began to penalize employers.


These are just coincidences, and more likely have something to do with Russia.


Thursday, May 19, 2016

Judge the Federal Dept of Labor by Intentions, not Results

According to the Department of Labor, it is now adding 4.2 million workers and their employers to those required to obey detailed federal regulations on weekly pay and work hours. The stated intention is to help women and other relatively low-income employees.

Most of those 4.2 million workers are earning significantly above the straight-time minimum wage rate. For them, economic theory and evidence (e.g., Prof. Stephen Trejo, now of the University of Texas, wrote his dissertation on this at the University of Chicago) suggest that their straight-time wage rate will be lower than it would have been if the DOL had not changed the rules. This will make their income more cyclical -- making them poorer when their incomes are low and richer when their incomes are high -- with little effect on their average pay or hours.

Trejo's results suggest that there will be also some adjustment of employment and work schedules. Because the new regulations apply only to workers earning below about $48K per year, they create incentives to reallocate work from low-income workers to higher income workers. Another way of increasing income inequality!

This is a new cost for employers that disproportionately hire low-income workers, and ultimately for the customers that buy their products. This will cause some of those industries to shrink, perhaps leaving low-income people with less employment as well as less income while they are employed. It is possible that high-income workers benefit, as their industries are not harmed as much by the new rules. i.e., yet another way of increasing income inequality!

The new rules are about cash wages, and not fringe benefits, so another effect is fewer fringe benefits to help pay for the extra cash wages. The consolation for those of the affected workers that lose their health insurance: Obamacare! (No consolation for taxpayers, who will have to help pay for that problem).

You may have noticed that GDP per capita is hardly growing -- at a mere 1.3 percent per year over the past 3 years. An important reason for this is all of the new federal interference in how business is done. Obamacare already heavily distorts the workweek, especially for workers with incomes below $48K, and now these new regulations are adding to it. More and more, work schedules are being chosen to satisfy federal rules and less for creating value in the marketplace.

My promise: If you like your weak economy, you can keep it! Especially if you are a low-income worker.

Friday, January 29, 2016

Mulligan vs Fed Forecasts

In 2014, my book was predicting that Real GDP per capita would grow 0.2-1.5% per year through 2016-17.

At the same time, the Federal Reserve Board was predicting 1.2-2.3% per year.

There is still time to go, but as of 2015-Q4, the actual result has been 1.35% per year over 8 quarters.

Friday, October 2, 2015

Employment per capita drops 3 out of the last 4 months

through September. Below uses the same methodology I displayed in the past in order to include self-employed workers too. The self-employed component is volatile ... it would be nice to have some kind of error bands on this series ... but that is still work in progress.


Friday, August 7, 2015

Update on Employment per Capita

through July. Below uses the same methodology I displayed in the past. The self-employed component is volatile ... it would be nice to have some kind of error bands on this series ... but that is still work in progress.

Thursday, July 2, 2015

Update on the employment rate

through June. Below uses the same methodology I displayed in the past. The self-employed component is volatile ... it would be nice to have some kind of error bands on this series ... but that is still work in progress.

Friday, April 3, 2015

Update on self-employment and total employment

Again the headlines (today: "below expectations") are different from the totals including self-employment. Below uses the same methodology I displayed last month.

Friday, March 6, 2015

Fewer jobs in February?!

The headline payroll employment was (seasonally adjusted) higher in February than in January. However, the headline does not include the self employed or agricultural workers. If we add those in (from the household survey), the number of jobs fell from Jan to Feb. If we also look at it per capita terms, jobs per capita fell two months in a row after being essentially constant Nov-Dec.

Jobs in Thousands through Feb 2015

Jobs per Adult through Feb 2015

To be clear, I am measuring the vast majority of jobs from the same establishment survey that makes headlines. All I'm doing is adding an estimate for the narrow category of workers known to be excluded (in terms of FRED series, my formula is PAYEMS + LNS12027714 + LNS12032184). Interestingly, self employment fell 340,000 in the past month and 238,000 over the past year.

Wednesday, November 26, 2014

Real PCE per person

Real PCE per person was less in October than in August.  Year-over-year, it has grown 1.4 percent.


Real GDP per capita has grown 1.7 percent year-over-year.


Saturday, November 15, 2014

CSPAN covers economic impact


At the 4:58 mark, Dr. Aaron acknowledges that "there is a tradeoff." That was a big surprise to me, because Dr. Aaron was the lead signatory on the economists' letter to Congress saying that there is no tradeoff: the ACA both helps people and grows the economy.

Friday, October 31, 2014

PCE growth

Personal consumption expenditure per capita has grown only 1.1 percent over the past 12 months

Friday, October 3, 2014

Labor Market Jumps in September

The labor market really jumped in September. Part of this is rounding error on weekly hours, which went to 34.6 after six consecutive months at 34.5 (the jump from 34.4 to 34.5 can be seen by comparing January and March of this year. In Jan of this year average weekly hours jumped from 34.3 to 34.4). But it is still surprising because the jump is more than twice the amount created by rounding error.

Monday, September 29, 2014

Real PCE in August

Real personal consumption expenditures per capita grew a lot from July to August (0.5 percent in one month; annualized that's 5.7 percent). The year-over-year growth is 1.9 percent; about a quarter of that growth occurred in one month. Over the prior three years, real PCE per capita had been growing 1.3 percent per year.