Showing posts with label opioid epidemic. Show all posts

Saturday, March 27, 2021

Misleading Baltimore Stats for Celebrating Lax on Crime

In 2020, the City of Baltimore stopped prosecuting "minor charges" such as drug crimes.  The headlines are that 2020 crime "went down a lot" from 2019.  Homicides fell by 13.

Not mentioned is that, over a similar time frame (2020 Q1-Q3 vs 2019 Q1-Q3), "Opioid Intoxication Deaths" increased by 48 persons (at an annual rate).  That is an increase of 36 percent, compared to 21 percent for the rest of the state of Maryland or 3 percent for Baltimore 2018-2019. 

Of course a lot of unusual things happened during the pandemic, which was also experienced by the rest of Maryland and the world.  But is there any reason to be confident that lax enforcement of drug laws would not increase activity associated with fatally dangerous drugs?

Tuesday, March 31, 2020

What's Happening with Drug Abuse?

I don't know where to find very recent counts of drug overdoses.  Below is alcohol sales, showing that the sales increase is greater for higher alcohol content (up to 75 percent for spirits).


If the increase in drug overdoses were also 75 percent, that would be an increase of about 1000 fatalities per week.

Wednesday, March 11, 2020

Subsidizing Addiction

In both 2015 and 2016, U.S. life expectancy fell from the previous year. A single-year drop had not happened in 22 years, and two consecutive drops had not occurred in more than 50 years. This sharp reversal in the national trend toward longer lives is widely understood to be connected to the opioid epidemic that began in the 1990s. The best kept secret about the epidemic, however, is how much of it – arguably most of it – resulted from Federal policy changes initiated by both Democrats and Republicans.

Opioids include prescription drugs like oxycodone as well as illicitly manufactured drugs like heroin and fentanyl. Since 2000, the Federal government has increased subsidies on both types of opioids and cut taxes on illicit opioids.

Medical professional organizations like the American Pain Society have been criticized for recommending more aggressive opioid prescription practices and downplaying addiction risks. But the effects of their recommendations would have been less severe without the Federal dollars that supported them. Beginning in 2000, the Veterans Health Administration (part of the Federal government) mandated that pain be seen as “the 5th Vital Sign,” which meant that pain would be routinely screened for and documented primarily based on patient self-assessments. Years later, the new Secretary of Veterans Affairs would report that veterans were twice as likely to die from opioid overdose than the general population.

This new approach would soon enter into civilian practice too, with three phases of financial encouragement from the Centers for Medicare and Medicaid Services. CMS has long conditioned hospital reimbursement under its massive Medicare and Medicaid programs on hospital quality assessments by the Joint Commission on Accreditation of Healthcare Organizations, another accreditation organization, or state survey agencies. In 2001, pain management became part of the accreditation process, putting billions of CMS dollars at stake. The second phase of incentives began in 2007, when CMS began withholding two percent from full reimbursement if a hospital failed to participate in the patient survey known as HCAHPS; hospitals and doctors discovered that their performance on the survey improved if opioids were liberally prescribed. The third phase began in 2012, when CMS implemented the “valued-based purchasing” (VBP) requirement provided for by the Affordable Care Act, which tied hospital reimbursement even more strongly to the HCAHPS survey. CMS would spend the next seven years taking steps to reduce these financial incentives for aggressive opioid prescribing.

Federal subsidies benefiting opioid consumers were probably even larger. In 2006, Medicare began to cover prescription drugs pursuant to its new “Part D” program. Although most Medicare enrollees are elderly, many of their prescriptions ended up in the hands of nonelderly people. Citing a family physician from Ohio, Sam Quinones’s book Dreamland asserts that “seniors realized they could subsidize their retirement by selling their prescription Oxys [a potent opioid] to younger folks. Some of the first Oxy dealers, in fact, were seniors who saw the value of the pills in their cabinets. ‘It’s like hitting the Lotto if your doctor will put you on OxyContin…. People don’t even think twice about selling.’” The White House Council of Economic Advisors (CEA) estimates that three-fourths of the growth in prescribed opioids between 2001 and 2010 were financed by government programs.

The 2010 Affordable Care Act requires health plans (especially Medicare) to cover “benzos” – prescription tranquilizers like Valium and Xanax. Benzos are part of the opioid crisis because they are the other half of the risky opioid-benzo cocktail that is favored by many opioid abusers. The tranquilizers enhance the feelings connected to opioid consumption, including the consumption of heroin and fentanyl. In other words, unlike the 2006 Medicare subsidies, which apply only to prescription opioids, the ACA’s benzo subsidies increase the demand for illicit opioids too.

In 2013, Attorney General Eric Holder took a step toward ending the war on drugs by instructing Federal attorneys that they should not prosecute low-level drug offenders. As I explain in my recent paper, this amounts to a tax cut on illicit opioids that would presumably reduce their street prices.

As far as I can tell, these policies went ahead because much of the Federal government did not grasp the full extent of the opioid epidemic. The Federal Register (the daily publication of US government agencies), reveals the Federal priorities at the time. Every 10,000 pages published between 2009 and 2016 had only six documents mentioning “opioid,” “opioids,” or “opiate.” In contrast, the same 10,000 pages had nearly 40 documents mentioning “climate change.” As recently as 2013 – the third consecutive year in which the death rate was almost triple normal levels – the Congressional Record mentions “climate change” 27 times more often than “opioid” or “opioids.”

Regardless of whether the government increases subsidies or cuts taxes, the result is lower prices paid by the opioid consumer, making opioid addiction more affordable. The CEA’s recently released 2020 Economic Report of the President estimates that, adjusted for inflation, out-of-pocket prices for prescription opioids fell by a factor of five between 2001 and 2010. (CEA’s price data is graphed below.) More recently, the quality-adjusted price of illicit opioids fell by at least a factor of two.
subsidizing-opioid-crisis
Studies have shown that opioids and other addictive substances obey the law of demand: lower prices mean more demand. If nothing else, the reduced prices for opioids have sharply increased the number of people who can afford an opioid addiction. CEA estimates that lower prescription opioid prices explain 31 to 83 percent of the increase in the death rate from 2001 to 2010 involving prescription opioids. This estimate does not include the additional effects of subsidies for benzos or hospitals, or the effects of reduced heroin prices since 2010.

Without the new subsidies supporting opioid addiction, the number of fatalities from opioid overdoses would be significantly lower, and maybe it wouldn’t even be called an “epidemic.”


Wednesday, November 6, 2019

"They desperately tried to prevent the truth..."

"They desperately tried to prevent the truth about the Famine from reaching the ears of the higher ups."
Raleigh, Helen. Confucius Never Said (p. 25).


Raleigh and others have described the problems in Mao's China and Stalin's USSR with communication up the political hierarchy.  But of course for Americans that history is hardly relevant.  In the USA, truth reaches the higher ups because we have democracy, a free press, and modern technology.  And we don't have famines.

But we do have an opioid epidemic.  Below we see how it took almost 20 years for the U.S. government to pay attention, as measured by word frequencies ("opioid" or "opioids") in the Federal Register.


Only in 2017 did the opioid epidemic get as much attention as climate change.

Alternatively, we could look at the Congressional record, where the words "opioid" or "opioids" appeared exactly zero times as recently as 2014 (a year in which "climate change" appeared over 300 times).


Friday, October 25, 2019

Tragic consequences of cheap "meth": more meth consumption and more meth overdoses

The illegal drug meth has been getting a lot cheaper, due to technological "progress" in manufacturing.  I have been telling people this for a while and that the tragic consequence will be more overdoses, but most people are under the (false) impression that drug overdose reflect only deaths of despair rather than a movement along a stable meth-demand curve as a result of increased supply.


Now the evidence of additional meth-involved overdoses is coming in.

See also the 2019 CEA report on the role of prices in drug overdoses.

Friday, August 2, 2019

Economic Theory in the White House: An Index of 67 Instances in One Year

It is difficult to exaggerate the usefulness of Chicago Price Theory for economic analysis in the White House.  Below is an index of 67 instances that I can remember where Chicago Price Theory was directly and specifically applied to analysis (usually publicly released) of economic issues over a one year time frame.  As an example of what I mean by "directly and specifically," compare Chicago Price Theory's Figure 19-3 to Figure 7-2 in the 2019 Economic Report of the President.

Figure 19-3 from Chicago Price Theory

From the 2019 Economic Report of the President
(the second derivative of the after-AI demand curve is part of the discussion in both sources).


Economic issue analyzed by CEA CPT pages
ACA employer mandate 75 - 75
Agency Compliance with Circular A-4 131 - 132
Artificial Intelligence and the labor market 120 - 121
Artificial Intelligence and the labor market 132 - 133
Artificial Intelligence and the labor market 147 - 148
Artificial Intelligence and the labor market 176 - 179
Artificial Intelligence and the labor market 182 - 183
Artificial Intelligence and the labor market 186 - 186
Artificial Intelligence and the labor market 189 - 191
Artificial Intelligence and the labor market 195 - 196
CEA's sample of 20 deregulatory actions 7 - 9
CEA's sample of 20 deregulatory actions 59 - 61
CEA's sample of 20 deregulatory actions 131 - 132
CEA's sample of 20 deregulatory actions 135 - 138
CEA's sample of 20 deregulatory actions 140 - 144
Corporate-income taxation 184 - 185
Corporate-income taxation 185 - 186
Corporate-income taxation 210 - 210
Green New Deal 116 - 119
Green New Deal 131 - 132
Health insurance deregulation 59 - 61
Health insurance deregulation 102 - 103
Health insurance deregulation 131 - 132
Health insurance deregulation 150 - 150
HHS Removal of Safe Harbor for Rebates 66 - 72
HHS Removal of Safe Harbor for Rebates 140 - 144
Highly socialist countries 135 - 138
Highly socialist countries 150 - 150
Macro effects of trade policy 32 - 32
Macro effects of trade policy 176 - 179
Measuring Rx drug prices 48 - 55
Measuring Rx drug prices 55 - 57
Medicare for All 157 - 159
Medicare for All 160 - 161
Medicare for All 168 - 170
Medicare for All 176 - 179
Medicare for All 209 - 209
Opportunity Zones 98 - 99
Pandemic Innovation Values 206 - 206
Telecommunications deregulation 7 - 9
Telecommunications deregulation 79 - 81
Telecommunications deregulation 102 - 103
Telecommunications deregulation 140 - 144
Telecommunications deregulation 150 - 150
The "doubling effect" of switching from reg to dereg 106 - 107
The cumulative impact of regulation (conceptual) 116 - 119
The cumulative impact of regulation (conceptual) 120 - 121
The cumulative impact of regulation (conceptual) 131 - 132
The cumulative impact of regulation (conceptual) 132 - 133
The cumulative impact of regulation (conceptual) 135 - 138
The cumulative impact of regulation (conceptual) 147 - 148
The cumulative impact of regulation (conceptual) 176 - 179
The opioid epidemic 7 - 9
The opioid epidemic 44 - 45
The opioid epidemic 66 - 72
The opioid epidemic 74 - 75
The opioid epidemic 128 - 129
The opioid epidemic 131 - 132
The opioid epidemic 135 - 138
The opioid epidemic 204 - 206
USMCA 96 - 98
Wage growth 48 - 55
[redacted regulatory impact analysis] 48 - 55
[redacted regulatory impact analysis] 157 - 159
[redacted regulatory impact analysis] 186 - 188
[redacted trade deregulation] 131 - 132
[redacted trade deregulation] 135 - 138

I suspect that this is historically unusual.  For example, the neoclassical growth model (standard training in Economics PhD programs and on pages 176-196 of Chicago Price Theory) had never been mentioned in an Economic Report of the President until 2018.  In 2018 and 2019 that model was used to address several policy questions, especially those cited above. 

Tuesday, July 9, 2019

"No One in Ohio Cares About Burma": The Washington Bubble

Less than 600 Federal employees are directly accountable to the voters.  Almost a half million Federal employees live in the DC metro area and are accountable to someone who lives in the DC metro area.  Naturally, Federal agencies are sensitive to media coverage, and journalists and think tanks covering Federal matters also disproportionately live in the DC metro area.

This results in groupthink, a.k.a., the Washington bubble.  Groupthink results in unnecessary errors, of which being surprised by the 2016 election is the most famous instance of a large sample.

Both General Kelly and Mick Mulvaney encouraged EOP staff and agency leadership to spend time outside the Washington bubble.  E.g., holding policy events outside the bubble, or even going to the site of a Presidential rally.  CEA’s high turnover helps too, although professors living near DC are disproportionately interested in taking a CEA position.

I went home to Illinois every other weekend and immediately noticed the contrast.  Here are three examples drawn from those trips.

The opioid epidemic.  Between 2009 and 2016, there were over 100,000 U.S. overdose deaths involving illicit opioids (especially illicit fentanyl).  I have been to funerals in Illinois where overdose was the cause of death.

Yet, in the Washington bubble, attention to this subject was low.  The CEA published 16 Economic Reports of the President during the Bush and Obama Administrations, and none of them mentioned opioids, overdoses, or heroin.  By comparison, the 2013 Economic Report of the President had a full chapter on climate change.  (That attention to the opioid epidemic changed beginning with President Trump's CEA).

I’ve read two memoirs from staffers in the Obama White House.  Rhodes’ memoir mentions climate change 21 times (Trump is mentioned 95 times) but never the opioid epidemic.  The 2016 meeting between Presidents Obama and Xi receives a lot of attention in the book because climate change was discussed, but no mention of the Chinese production and export of illicit fentanyl (fentanyl was a topic of the meeting, but apparently not important enough to explicitly appear on the White House fact sheet, which did mention space debris and protecting elephants). 

(A related film that also features Samantha Power and Susan Rice also has a lot of climate change and zero opioid epidemic).

Pfieffer’s memoir mentions climate change 9 times (Trump 303 times) but never the opioid epidemic.  (The "fact-checked" memoir does find space to declare that, with President Trump, we staff "wander[] the halls of the White House doing dumb, mean, s[]t"). 

In contrast, the memoir Hillbilly Elegy -- cited by the New York Times as one of "6 books to help understand why Trump won" -- mentions climate change zero times and (in some detail) the opioid epidemic ten times.

To be a bit more systematic about this, I looked at google trends for “fentanyl” and “climate change” state by state over the past 5 years.  The results are well summarized by comparing Ohio and DC, both of which had age-adjusted overdose death rates of 39 people per 100,000 in the year 2016.  By this metric, Ohio's attention to fentanyl was more than triple DC's, as shown in the chart below.


Wage stagnation.  Last summer the bubble’s economic meme was that real wages had “stagnated”: that is, since 2016 (if not longer) worker’s wages had not advanced beyond inflation and that workers were suffering from “feeble bargaining power.”

Meanwhile back home I was seeing more striking workers than I can ever remember.  Is that what feeble bargaining power means?  Local friends and neighbors asked me “I read/heard about this ‘wage stagnation’ stuff – why aren’t I seeing it in my line of business?”

CEA had been working on a report about measuring wage growth, using the economic literature on how to do such things.  The report showed that wages were growing significantly more than inflation; the groupthink was wrong.  More surprising, some of the perpetrators of the groupthink acknowledged that they had suspected that real wages were growing but for some reason did not speak up about their understanding until CEA’s report was published.  (The charitable interpretation is that, living in the bubble, they viewed it as too risky to say what they knew until CEA offered more evidence as protection).


The cost of an American lifestyle in a Nordic country.  As part of its work on socialism, CEA looked at the costs of living an American lifestyle in a Nordic country.  Part of the American lifestyle is driving a vehicle.  Because the top three selling vehicles are pickup trucks (I see them all the time at home), our October socialism report looked at the cost of owning and operating a pickup truck in Nordic countries.

That was a mistake (entirely mine).  Although the President’s speeches (which rely on some of CEA’s socialism findings) are for the entire country, CEA reports are primarily read inside the Washington bubble where pickup trucks are objects of derision.  So the subsequent Economic Report of the President's socialism chapter deleted all references to pickup trucks and change the analysis to a Honda Civic.


Much of the public has an interest in bringing outsiders into elected Federal offices.  While an outsider can initiate important changes, he still has the challenge that much of the Federal manpower lives and works in the Washington bubble, if not originating from it.

Many among the UNELECTED in the Washington bubble are unaware of the gaps above, and at best dimly aware of any gap at all, between them and the rest of the nation.

Take Ben Rhodes (unelected), who had to be repeatedly reminded by (elected) President Obama that "no one cares about Burma in Ohio" (pp. 174, 390 of Rhodes' memoirs).  Mr. Rhodes absorbed the lesson well enough to italicize it in his book, and well enough to recall that candidate Obama himself ran against the DC bubble (p. 403), but not deeply enough to think about gaps such as those mentioned above (or the economic damage from Obamacare, historic regulatory overreach, etc.) that in principle his party could manage.  Even with a year of reflection, the best he can discern is that his party lost the White House and both houses of Congress primarily due to "racist, mean-spirited, truthless politics" (p. 401).

The best Dan Pfeiffer (p. 95) can discern is that technological change in journalism created an environment where a purportedly unqualified outsider could win a Presidential election.  Pfeiffer does perceive that the economy may be one issue among many (pp. 269-71), but only regarding economic messaging; there were no policy mistakes between 2009 and 2016 that caused significant and genuine harm to voters living outside the Washington bubble.

There is a London bubble too, with a large gap in perspectives between those living in the London metro area and those living elsewhere in Britain.  Sir Kim Darroch invited me, several White House staffers, and many others from DC to an April event at the British embassy with Phil Hammond as guest of honor.  I was shocked that the public remarks were so straightforward as to their continued disdain for UK and US voters' decisions, almost 3 years past.  I expected that Darroch and Hammond would have short political life spans but not so short that Darroch would enter political intensive care already today.

As the Spectator put it,
"This high-handed [policy-making] process relieves us of the burden of thinking about what our rules will do to individuals on the receiving end. In its own way, this is a species of dehumanisation; when people rebel at the ballot box, we are shocked."

[My experience at the Irish embassy was entirely different (a smaller group with Finance minister Paschal Donohoe and Ambassador Daniel Mulhall).  Although preferring that UK remain (Ireland is part of the EU, so exit would put an EU-nonEU barrier on their island), these smart, thoughtful people understood why many British would want to Brexit.  Perhaps there is no "Dublin bubble"?]

Consider it good news for US political outsiders that the Washington bubble shows little sign of adjusting its outlook.

[update: I just got the Susan Rice memoir.  It mentions opioids, heroin, fentanyl, and drug overdoses zero times.  Climate change/policy appears 22 times.  Trump appears almost 100 times.
update2: I just got the Barack Obama memoir.  It mentions opioids, heroin, fentanyl, and drug overdoses zero times.  Climate change appears 60 times.  Trump appears 31 times.  (The counts exclude the index and references).]


Monday, July 1, 2019

A Brief Summary of Activities in President Trump's Council of Economic Advisers


From July 2018 to June 2019, I served as Chief Economist of the Council of Economic Advisers (CEA). My primary responsibilities were preparing public reports, supervising senior economists and interacting with various groups in the White House and in the relevant agencies on a wide range of topics.  As CEA engaged in topics, they were picked up by Kevin Hassett (especially tax and trade), Tom Philipson (esp. health, infrastructure, student loans), Rich Burkhauser (esp. labor, immigration, and social programs), or me (Affordable Care Act, socialism, regulation, wage growth, macro aspects of trade).  On some of the topics I worked serially or in tandem with Tom (health insurance regulation, Medicare Part D, the Rx CPI, opioid prices) and in tandem with Rich (TROIKA).

The large majority of my time was in various stages of preparing Administration reports for the public, most of which were CEA products although OMB publishes the TROIKA results and the agencies publish rulemaking documents (which CEA sometimes edits).

Typical activities: Supply and Demand
The pace and daily execution of my work closely resembled academic research and economics consulting in litigation matters.  This is probably unusual in the history of the CEA, but was the result of three practices:
  • anticipating the needs of POTUS and EOP economic principals,[1]
  • fitting questions into the catalog of economic theory so that established methods and literatures could be used to quickly obtain reliable answers,[2] and
  • using already-published CEA reports to facilitate accurate and consistent execution of new tasks.

Much public policy discussion is devoid of economics and thereby obscures evaluation of current Federal policies.  Invariably these were policy areas where EOP principals most valued CEA’s work.  Socialism and Medicare for All (see also their updates in the in 2019 Economic Report of the President) are good examples where CEA was able to initiate or at least bend the conversation by assembling results from economic research.

Probably the best tool is the empirical counterpart of the supply and demand picture.  That is, measuring both price and quantity using the best methods available in the academic literature.  CEA is desperately needed to perform this function.  The current CEA already has 11 instances of those pictures in its Economic Reports of the President, as compared to only 8 for all of the combined other Presidential Administrations in U.S. history.[3]  This may seem to be a trivial enterprise, but the “best” in our profession fail at it regularly (see below and here and here).

With the labor market, for example, the public policy community is familiar with methods for measuring quantities (employment, hours, unemployment etc.) but unfamiliar with measuring prices (i.e., wages).  CEA measured wages with attention to composition issues, human capital, taxes, etc., and thereby helped change the factually incorrect narrative that real wages were “stagnating.”

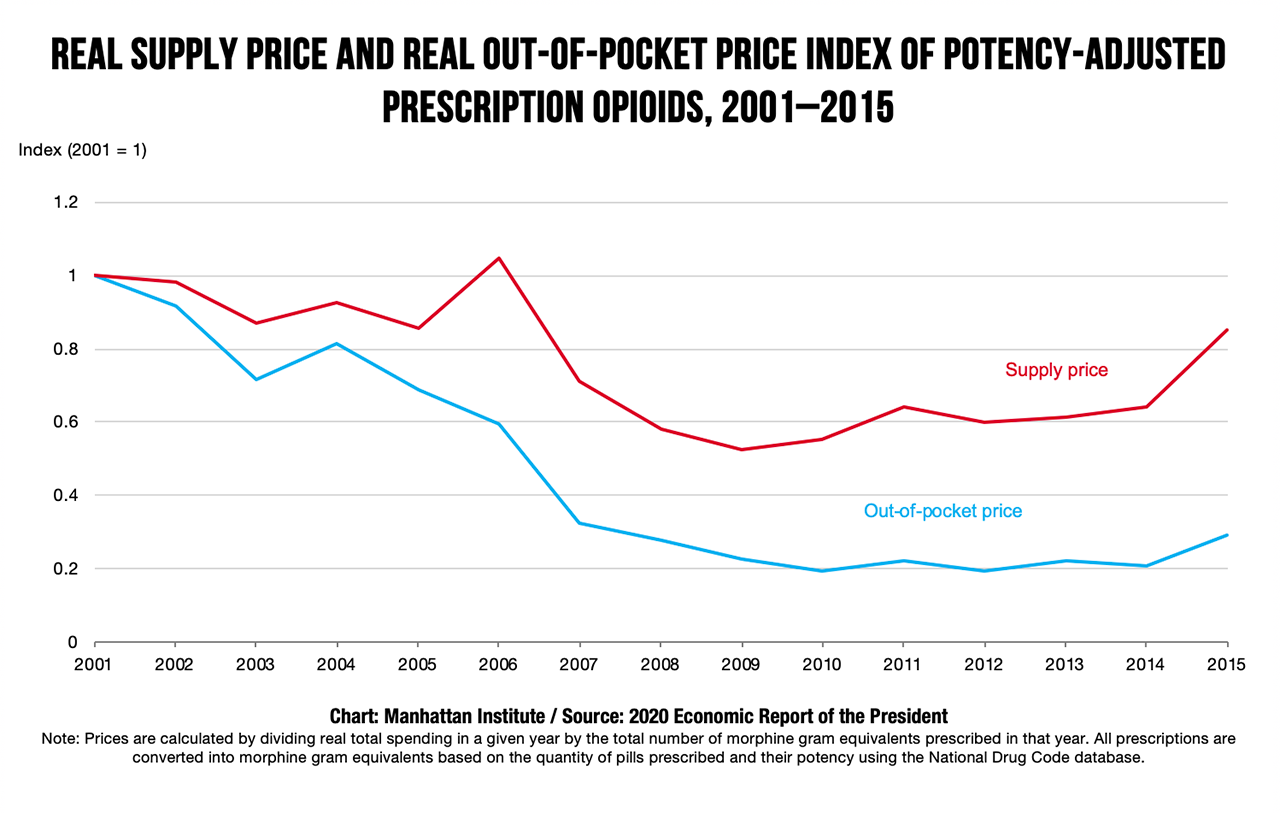
Prescription drugs are another important example.  The typical narrative (including at HHS, which sees itself as the drug-price regulator) was that prescription drug prices were increasing faster than general inflation, as they had for decades. But, with attention to the institutional details of the supply chain, CEA found that the best measures showed an increase in quantities of prescriptions at the same time that prices have been falling over the past two years or so.

With the decades-long opioid epidemic, public policy discussions still ignore prices altogether: another opportunity where CEA made a valuable contribution by following standard economic practice.  (More on this tragic and ongoing story in later posts).

CEA’s trade team executed these methods repeatedly as various tariff rates were changed.

CEA took a similar approach to the Affordable Care Act, where we found that Trump Administration reforms were significantly reducing health insurance prices measured according to a cost of living index.  CEA’s public report on this issue presented the dual of the cost-of-living index, namely cost-benefit analysis.  This spawned many other regulatory impact analyses by CEA that laid the foundation for its report on the economic effects of the Trump Administration’s deregulation portfolio.  I worked closely with Don Kenkel (now the CEA Chief Economist) on these issues throughout the year.

One Economics
I looked carefully and critically at the headline calculations of all CEA reports released during the year (beyond the 12 reports or ERP sections that I edited), as well as the corporate tax reports released at the end of 2017.  The essential methods and sources for these calculations proved to be consistent across reports including, but not limited to, tax, immigration, health, socialism, and regulation.

A three-good version of the neoclassical growth model with taxes was another workhorse that links industry-specific analysis with macroeconomic analysis.  The three goods are leisure and two consumption goods (but see below).  CEA used that to look at Medicare for All (health consumption vs other consumption), tariffs (tariffed goods vs other goods), and dozens of regulations (regulated good vs other consumption goods). We also used it to look at business tax reform and investment regulation, where there is just one consumption good but two capital goods (corporate vs noncorporate).  We typically focused on the steady state and took a broad view of “taxation” that encompasses other market distortions.  We derived quantitative rules of thumb (such as the well-known marginal excess burden of taxation) for the effects of a single sector’s distortion on the aggregate supplies of labor and capital.

I frequently used automated economic reasoning (run with Mathematica with an add-on from the web) to confirm, refine, and extend our reasoning about the three-good model and other applications of logic and economic theory that went beyond the simplest supply-and-demand framework.  I will be adding these examples (which embed hundreds of automatically assembled and decided Tarski formulas) to the library of SAT/quantifier-elimination applications that I maintain with computer scientists.

Working in a Large Organization
The Executive Office of the President (EOP, of which CEA is one of several components), not to mention the entire Federal government, is a large organization with components far more inter-reliant than the components of a university. Professors joining CEA need to be aware that staff meetings are critical for keeping information flowing to the parts of the EOP that need it.  As you attend EOP meetings in your subject area, be prepared to share headlines with the rest of the CEA staff at the staff meetings and listen to others to assess who in CEA or outside CEA might be of help for the next task that arrives.

The EOP has a staff hierarchy for the same reasons, although many employees adhere to it so rigidly that there is a role for organizational entrepreneurs who cross some of those boundaries, which is a role I took on in much of my work.  Otherwise meetings of principals (a.k.a., cabinet-level positions) and deputies (report directly to principals) may not have anyone present who knows first hand the details of the meetings’ subject.  I presume that this is also a problem in large private organizations, but more acute in government where leaks are more of a constraint on determining who is invited to meetings (see, e.g., this memoir’s discussion of leaks in the Obama White House).

CEA Chairman Hassett and COS DJ Nordquist assembled an amazing team of economists.  I also worked closely with six other components of the Federal government: the Office of Management and Budget (OMB), the National Economic Council (NEC), the Office of Information and Regulatory Affairs (OIRA, technically part of OMB), the Domestic Policy Council (DPC), the Department of Labor (DOL), and the Department of Health and Human Services (HHS).

Every day working in the EOP was a pleasure (Mick Mulvaney = Phil Jackson; the Kelly-Collins analogy is imperfect). It is difficult saying goodbye to so many excellent EOP colleagues but by design CEA has high turnover so that others outside can come in with fresh ideas and energy.

[In returning to the University of Chicago, I return to publishing under my own name and take sole responsibility for the analysis and conclusions.  As such, the Federal government is not consulted on my writings.]


[1] E.g., measuring wage growth properly, exposing misconceptions about single-payer systems, highlighting the consequences of deregulation from autos to prescription drugs.
[2] A forthcoming blog post will list more than 50 results from Chicago Price Theory (forthcoming, Princeton University Press) that appear in public CEA reports.
[3] CEA, which is tasked with preparing the Economic Report of the President, dates back “only” to 1946.