Wednesday, October 10, 2012

Don't Blame the President for the Baby Boom

Copyright, The New York Times Company


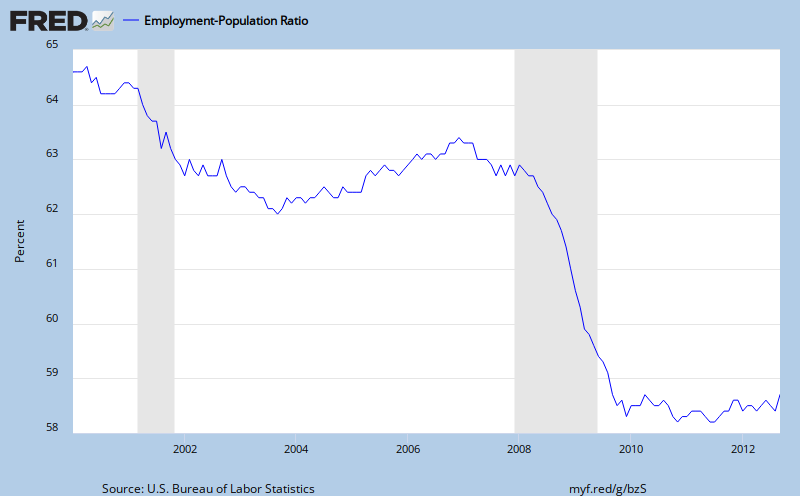
Thanks in part to the baby boom, the employment-population ratio understates the amount that the economy has recovered.

Before the recession began, 63 of every 100 people age 16 and over were employed. The percentage plummeted to 58.4 by the fourth quarter of 2009 and hasn’t moved far from there since.

A variety of economists have used the ratio and its dynamics to indicate that the economy has hardly recovered. Some say the employment-population ratio’s lack of recovery is because of insufficient government spending; others suggest that it might reflect policy failures of the Obama administration.

But the employment-population ratio is influenced by important factors beyond the control of the president. One of them is the aging of the baby boomers. The employment-population ratio was expected to fall as baby boomers reached retirement ages between 2008 and 2015, even without a recession. For this reason alone, a full recovery would mean an employment-population percentage of about 61.

Although much attention last week was given to the August-to-September increase in part-time employment, the average hours worked among private-sector employees have increased sharply since 2009 and are now about the same as they were before the recession began.

The chart below shows a recovery when the quantity of labor is measured in terms of hours worked per capita (gray) or age-adjusted hours worked per capita (red). Both indexes are set to 100 in December 2007; the age adjustment is taken from my book on the labor market since 2007.

The red series hits bottom at 90.8 and now stands at 94.4. Unlike the employment-population ratio’s negligible recovery, the age-adjusted hours series has recovered about 40 percent — four points — in three years.

To be sure, an additional six points of the recovery still remain, and the labor market continues to be depressed by public policies enacted over the last four to eight years. But some of these policies, such as mortgage assistance, the three increases in the federal minimum wage and the federal rules giving states more flexibility to expand food-stamp participation were begun before President Obama took office and probably would not have been overturned if John McCain had won the 2008 election. Some of those policies had broad political support.

Thanks to demographic and political changes, a full labor market recovery may be beyond any president’s reach.

Tuesday, October 9, 2012

Sales Tax Hikes During the Recession

Sales taxes have been hiked by several states and localities as their revenues declined with the economy. I estimate that the weighted-average state sales tax rate increased 0.5 percentage points from 2007 to 2010.

When you consider the narrowness of the sales tax base relative to the payroll tax, the state sales tax hikes are equivalent to a 0.2 percentage point payroll tax hike in terms of their national labor market impacts.

Monday, October 8, 2012

Keynes, Labor Supply, and Depressions

If alive today, would Keynes join most of the economics profession and assess the current economic situation without any reference to labor supply incentives?

I don't know, but it is worth noting that Keynes' writings about periods of high unemployment consider supply incentives more than his 21st century followers do. In particular, his 1919 Economic Consequences of the Peace repeatedly looks at supply channels.

Europe at the time had a population of 450 million people. I believe that unemployment was a problem at the time, but more important I think Keynes perceived it to be a problem as he describes "that 15,000,000 families were receiving unemployment allowances." If we assume that a 450 million population would support a labor force of about 150 million (ie., excluding women, small children, and noting that the post-war population was likely disproportionately female), that makes an unemployment rate of at least 10% and more to the degree that (as is the case today) some of the unemployed were members of families not receiving assistance.

Notably absent from his extensive discussion of the supply of commodities is the qualification offered by modern-day Keynesians that we don't have to worry about supply constraints until the economy is at full-employment. Instead, he describes how (in the context of describing how price regulations are futile) people may not exert effort if they do not find it sufficiently profitable:

...the regulation of prices, contains in itself, however, the seeds of final economic decay, and soon dries up the sources of ultimate supply. If a man is compelled to exchange the fruits of his labors for paper which, as experience soon teaches him, he cannot use to purchase what he requires at a price comparable to that which he has received for his own products, he will keep his produce for himself, dispose of it to his friends and neighbors as a favor, or relax his efforts in producing it.

If you are open to the idea -- supported by extensive research -- that labor supply incentives might still matter during depressions, take a look at the startling findings in my new book The Redistribution Recession.

Friday, October 5, 2012

Food Stamps for Adults

Dean Baker claims today that people without children are unlikely to get food stamps:

"if they have no children they will probably not [be] eligible for food stamps or other government benefits."

I'm not sure what data he's using. Using the USDA's quality control files provided by Mathematica Policy Research, I found that over 5 million non-elderly, non-disabled adults without children were participating in the food stamp program by mid-2010, up from 2 million before the recession began.

Perhaps Dr. Baker forgot how the Obama administration stopped requiring Able-Bodied Adults Without Dependents (USDA officials call them ABAWDs) to be employed if they were receiving food stamps.

You can read about this and further SNAP eligibility expansions, and their depressing effects on the labor market, in my new book The Redistribution Recession, available for sale now.

Marginal Tax Rates by Age

Dean Baker claims today that the labor market experience of young people refutes my finding that redistribution is the single largest factor depressing the labor market since 2007. In doing so, he gets some of the facts wrong and neglects several economically important connections between redistribution and the labor market.


  1. I explain in The Redistribution Recession that, among household heads and spouses, safety net expansions did more to erode work incentives among young people than they did among middle-aged and elderly people because young people have wages that are relatively low compared to (a) the dollar amount added to safety net benefits, (b) the dollar amount of their unsecured student loan and other debt, and (c) the cumulative dollar amount of the three minimum wage hikes (Dr. Baker thinks that minimum wages don't affect employment among young people, but he's wrong about that too).  A $400 per month food stamp benefit is not considered small change to a person who was earning the pre-recession minimum wage of $5.15 -- they'd have to work over 80 hours to make that much after taxes.
  2. Redistribution affects labor demand too. Measured in terms of marginal tax rates, these effects are also larger for young people than for middle-aged people because young people are less productive. For example, if employers perceive a new unemployment-insurance-fund expense associated with each employee that was 3% of what middle-aged employees produce, and middle-aged employees are twice as productive, then the perceived expense would be 6% of what a young employee produces.
  3. Even if marginal tax rates had increased the same amount for young people as for every one else, labor economists believe that young people are more sensitive to incentives because they are not settled into an occupation (e.g., they could stay in, or go back to, school), do not have older (more expensive) children, etc.  In other words, a uniform increase in marginal tax rates need not create the same behavioral change for all groups.
  4. Dean Baker is confident that young people compete with middle-aged people in the labor market, so that a depressed labor market for middle-aged people would mean a boom for young people.  More work is needed on this issue (I treat it briefly in Chapter 5 of the Redistribution Recession), but I suspect the opposite: that the young and middle-aged are complements in production: young workers are not very helpful without more experienced people to supervise and train them, and otherwise be part of the larger production teams that are prevalent in our economy. A related phenomenon: young people are especially likely to work in restaurants or as babysitters, but when the middle-aged labor market is depressed middle-aged people will sometimes do their own cooking and childcare rather than hiring young people to do it.
  5. My book notes, even embraces, the fact that part of the depression of our labor market is not because of safety net expansions or other marginal tax rate increases.  But that is small part (my best estimate: 25% of the total depression, even while it is 95+% of the academic and public policy discussion), and is not dominant in the aggregate data.  As with any small effect, you might see it better if you zoom in on the right group.
  6. Most of my marginal tax rate work so far has pertained to household heads and spouses.  I would be happy if other economists, even Dr. Baker, would compute marginal tax rate series for teenagers and other potential workers who are not heads of their household, so we could see what lessons might emerge.

The Redistribution Recession is Available Now!

If you buy directly from the publisher.

It may take a week longer for on-line sellers to get their stock and get organized.


Wednesday, October 3, 2012

Why Did Wages Rise and then Fall?

Copyright, The New York Times Company


Aggregate wage-rate data show no sign of the huge and prolonged demand shock said to have hit the economy in 2008. Instead, they bear the fingerprints of an expanded social-safety net.

A conventional narrative of the American labor market since 2007 is that the demand for labor collapsed, so that despite a uniformly willing and eager work force, millions of people had to go without jobs. This narrative is an aggregate theory and not primarily about sectoral shifts that would depress demand for some types of labor and increase it for others. If this narrative is accurate, it should be visible in aggregate wage-rate data.

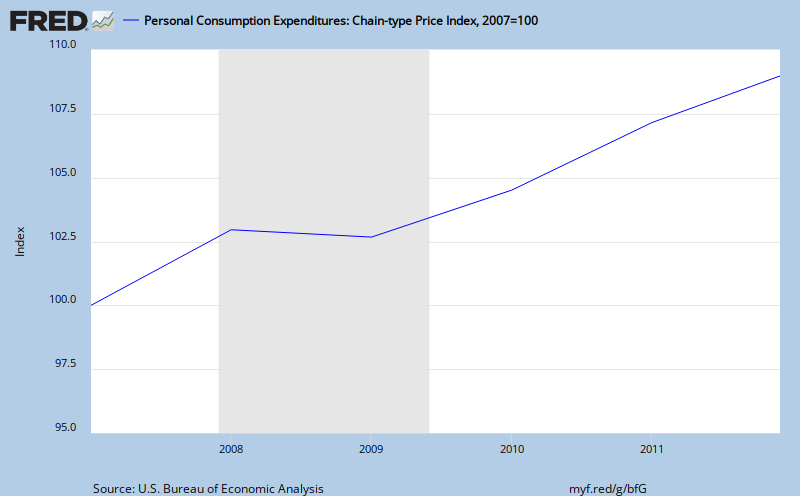
At a minimum, the aggregate demand collapse should have frozen wage rates in dollar terms, so that inflation-adjusted wages would erode with inflation as consumer prices crept up. With the price index for consumer items 8 percent higher at the end of 2011 than it was when the recession began, inflation-adjusted hourly wages should have fallen at least 8 percent over that time frame, if not more.

In my view, the change in aggregate demand has been heavily exaggerated, and the greater impulse affecting the labor market over the last five years has been higher marginal tax rates created by an expanding social safety net of unemployment insurance, food stamps, Medicare and other anti-poverty programs. Those tax rates, as I noted last week, refer “to the extra taxes paid, and subsidies forgone, as a result of working, expressed as a ratio to the income from working.”

I expected real wage rates (and hourly labor productivity) to rise in the short term, and to do so a couple of percentage points above the previous upward trend made possible by continuing progress of the productivity of labor and capital.

Marginal tax rates increase real wage rates a few percentage points in the short term because, with more help during unemployment, employees at struggling businesses have less reason to make some of the concessions in wages and working conditions that can help the employer to retain employees affordably.

As I explain in “The Redistribution Recession,” wage rates would quickly fall back toward the trend line when some of the temporary safety-net measures began to expire, which was two or three years after the recession began.

Those safety-net expansions that were permanent would eventually reduce average real wage rates, as people out of work reduced their human capital investment. This reduction might reflect people who, because they no longer practice a trade, lose contacts in the workplace or no longer maintain a wardrobe or tools they need for work. (For more on this effect, see especially the literature on women’s wage trends.) Unfortunately, these wage reductions do not encourage employers to hire because they derive from reductions in productivity.

The black series in Chart 1 below shows aggregate real wage rates measured as inflation-adjusted employee compensation (including fringe benefits like health insurance) per hour worked. I have removed an upward trend, because for short-run analysis it is interesting to look at deviations from trends. Under normal conditions real wages can increase with productivity even while the amount of labor is neither rising nor falling.

The trend adjustment is 0.5 percent a year, based on the average rate of growth of total factor productivity during the four years before the recession. Without the trend adjustment, the black series would increase two percentage points more through 2011 than shown.The trend adjustment is 0.5 percent a year, based on the average rate of growth of total factor productivity during the four years before the recession. Without the trend adjustment, the black series would increase two percentage points more through 2011 than shown.

The chart also shows in red the marginal tax rate on labor income measured in my book for a typical household head or spouse based on the ever-changing eligibility and benefit rules for safety-net programs. Sure enough, real hourly compensation increased during the recession and did so about a quarter after marginal tax rates began their increase.

Marginal tax rates were high and fairly flat during 2009 and early 2010 as the “stimulus” law was in full force. During this time, real wages failed to fall back anywhere close to their prerecession values. Only when some of the stimulus provisions began to expire, reflected in a marginal tax rate that falls to 44 or 45 percent from 48 percent, did real wage rates decline quickly and significantly.

Even after the decline in late 2010 and early 2011, it looks as though real wage rates are about where the previous trend line was, rather than being the several percentage points below what one might expect after a huge, prolonged demand shock.

A few economists have used Census Bureau wage data, which ignore the fringe benefits from employment, to show that wages fell during 2010 and 2011. It is incorrect to ignore fringe benefits (I discuss this and other wage measurement issues in Chapter 2 of “The Redistribution Recession”), but the choice of series is just a quibble, because none of the aggregate wage measures display a cumulative decline that would be commensurate with the huge, prolonged demand collapse said to have occurred.

A magnifying glass is not required to see a decline in after-tax real wage rates. The after-tax real wage rate (calculated as the product of real hourly compensation and one minus the marginal tax rate shown in black in Chart 2), reflects the net financial reward per hour of working, taking into account taxes and safety-net subsidies.

TKTKTKTKThe after-tax real wage series has been adjusted for a trend of 0.5 percent a year.

Marginal tax-rate changes, such as those created by an expanding social safety net, cause deviations between the real hourly compensation shown in Chart 1 and the after-tax series shown in Chart 2. In theory, the downward marginal tax rate effect on after-tax real wages exceeds the upward effect on real hourly compensation.

In fact, after-tax real wages fell a startling 12 percent below the trend line during the first two years of the recession (note that each tick in Chart 2 is twice as large as each tick in Chart 1). They rebounded somewhat as marginal tax rates came off their stimulus highs but still remain six or seven percentage points below the trend line.

The quantity of labor — hours worked per capita including zeros for people not working – is shown as a red series in Chart 2. Remarkably, labor and after-tax real wage rates collapse together, hit bottom together and exhibit a partial recovery together.

Helping the poor and unemployed is intrinsically valuable, but is not free. It has made labor more expensive and depresses employment.

Friday, September 28, 2012

Recent Marginal Labor Income Tax Rate Changes by Skill and Marital Status


         The economy experienced an unusually deep and prolonged contraction, especially in its labor markets.  Employment and hours worked fell during 2008 and 2009 for many demographic groups, but disproportionately so among less skilled people, and among the unmarried.  As of 2012, labor market activity still remained far below pre-recession levels.  Over the same time frame, many facets of fiscal policy were changed, especially policies related to the distribution of safety net program benefits.
            Fiscal policymakers were of course watching the economy closely, and major safety net legislation was certainly a reaction to economic conditions.  But unless behavior is completely unresponsive to tax and benefit formulas, we cannot have a full understanding of the relationship between fiscal policy and the economy without quantifying marginal tax rates, their changes over time, and their differences across demographic groups.  The purpose of this paper is to help examine the labor market impacts of recent changes in safety net programs by measuring time series of implicit marginal labor income tax rates for the safety net as a whole and recognizing that marginal tax rates and their changes vary by demographic group.  In this regard, the paper is a longitudinal version of prior studies appearing in Tax Policy and the Economy that showed how implicit marginal income tax rates vary with household income and other characteristics under a single year’s tax and benefit rules.[1]
            Analysis of implicit marginal tax rates and their differences across groups might seem to be a specialized topic of poverty research, and only relevant for macroeconomic analysis to the extent that the economy is populated by poor people.  However, this paper explains how people from the middle and above-middle parts of the skill distribution can become eligible overnight for safety net programs such as unemployment insurance and now SNAP (formerly known as food stamps) merely by becoming unemployed for a period of time.  Thus, even skilled people have their incentives to seek and retain work determined in part by safety net program rules.  This paper shows that wide swaths of the skill distribution saw their marginal tax rates increase by more than five percentage points in less than two years.
            I consider the entire safety net, as well as payroll and income taxes, but give most of my attention to three programs spending the largest amounts on non-elderly households, and with significant legislative changes: unemployment insurance, SNAP (formerly known as food stamps), and Medicaid.[2]  I focus on the non-elderly population because the elderly have access to a different set of safety net programs and have a different (and weaker) relationship with the labor market.
My marginal tax rate concept is a comparison of the total amount of subsidies net of taxes received if and when a person were not working to the total amount received (or paid) if and when the same person were working full time, expressed as a fraction of the amount produced when working full time.  This measure is a marginal tax rate on the decision margin of working full time or not at all during a specific time interval.  In this regard, my tax rate concept is reminiscent of the implicit tax rates used by Gruber and Wise (1999) and collaborators in their “tax force” measures of the retirement incentives created by public pension and disability programs around the world.[3] 
            The relationship between subsidies received when not working and the amount that could be earned when working full time varies by demographic group.  A number of subsidies are set as specific dollar amounts (such as the SNAP maximum benefit, or the maximum unemployment insurance benefit), or as a specific bundle of services (as with Medicaid) regardless of how much the beneficiary might earn if he worked full time.  Unemployment insurance benefits below the maximum are, on the other hand, specified as a proportion of the amounts earned in prior employment.
Subsidies received by both employed and non-employed people also depend on the income of others in the household, and therefore can vary significantly by marital status.  Finally, subsidy rules have changed over time as new legislation was passed, and calendar time triggered new provisions in old legislation.  This paper therefore calculates marginal tax rates as a function of earnings potential, marital status, and calendar time.
The paper begins with its conceptual framework for measuring work incentives implicit in the composite of programs known as the safety net, with emphasis on isolating groups-specific changes over time that come from changes in safety net program rules rather than changes in the behavior of the population served under a fixed set of rules.  I then identify the changes in safety net eligibility and benefit rules that were significant for the non-elderly population.  The paper concludes with marginal tax rate series that combine the program-by-program results of earlier sections and a first indication of how changes in these rates were correlated with labor market behavior.
One point of view is that the labor market is slack during a recession, that as a consequence labor supply has nothing to do with labor market outcomes, and that household marginal tax rate calculations are of no help in understanding how people behave during recessions.  Even if this conception of slack markets were accurate, marginal tax rate changes are relevant because they tell us where the labor market is headed after it is no longer slack and supply incentives start to matter again.  More important, both theory and evidence might support the opposite point of view: that subsidies for the unemployed and the poor matter as much or more during a period of significant labor market distortions, in part because those subsidies loom large relative to low offer wages.[4]  The conclusion of this paper also presents a puzzle for the theory that labor supply has recently been irrelevant: that 2007-10 changes in work hours per capita correlate so closely across demographic groups with statutory changes in the incentives to work.


[1] See Liebman (1998) and Kotlikoff and Rapson (2007).
[2] Because subsidy program participation is voluntary, a subsidy cannot have a large effect on incentives or behavior unless it redistributes a significant amount of resources.  A tax program, on the other hand, can in principle create large marginal tax rates without redistributing much revenue.
[3] My tax rate is equivalent to a weighted average of (one minus) the local slopes of a worker’s budget constraint (in a graph of disposable income versus earnings from work), where the weights are the size of the income interval over which each local slope applies, because my tax rate is one minus the slope of the straight line connecting the no work point of the budget set to the full-time work point.  In this regard, some might say that my tax rate measures “extensive margin” incentives, which are a weighted average of “intensive margin” incentives.  However, readers should recognize that the concepts of intensive and extensive margins have a time dimension, which varies across studies and safety net programs.  For example, the decision whether to work in the month of August is an extensive margin decision from the point of view of a program that monitors beneficiaries’ labor income on a monthly basis, but an intensive margin decision from the point of view of a program such as the Earned Income Tax Credit that monitors income on a calendar year basis (unless not working in all of the other eleven months of that year).
[4] Mulligan (2012) reviews evidence on the cyclicality of labor market and production effects of marginal changes in labor supply and demand.  He finds that labor supply and labor demand shifts had essentially the same marginal effects on employment in 2008 and 2009 as they did in prior years.


Wednesday, September 26, 2012

Labor-Market Scars Left by Redistributive Public Policy

Copyright, The New York Times Company


The social safety net became more generous under Presidents George W. Bush and Barack Obama, and as a result massively altered employment patterns in the labor market.

I have explained in previous posts how public moneys have recently been used to help the unemployed, the poor and the financially distressed endure the recession, but at the same time have dramatically eroded incentives for people to maintain their own living standards by seeking, accepting and retaining jobs, as well as incentives for employers to create jobs that are attractive to workers.

My forthcoming book “The Redistribution Recession” (see the introductory chapter online) quantifies those incentives and their changes over time in terms of marginal tax rates, which refer to the extra taxes paid, and subsidies forgone, as a result of working, expressed as a ratio to the income from working.

As a result of more than a dozen significant changes in subsidy program rules, the average middle-class non-elderly household head or spouse saw her or his marginal tax rate increase from about 40 percent in 2007 to 48 percent only two years later. Marginal tax rates came down in late 2010 and 2011 as provisions of the American Recovery and Reinvestment Act expired, but still remain elevated – at least 44 percent.

Americans have different economic and family situations, and subsidy program rules are complex. As a result, the marginal tax rate changes for particular households vary significantly from the average eight-point increase. A few households even saw their marginal tax rates jump beyond 100 percent – meaning they would have more disposable income by working less.

Marital status and skill (that is, what people are capable of earning) are important determinants of the marginal tax rate and its changes over time. Married people saw their marginal tax rates increase less than average, because even when out of work they are likely to be ineligible for a number of antipoverty programs because of amounts earned by their spouse.

Skilled people saw their marginal tax rates increase less because a number of the new subsidies were fixed dollar amounts, and a fixed dollar amount is a lesser fraction of what a skilled person can earn than it is a fraction of what an unskilled person can earn.

Little attention has been paid to marginal tax rates lately, under the Keynesian assumption that the labor market is slack during a recession and that for the time being labor supply has nothing to do with labor-market outcomes. As Paul Krugman put it: “What’s limiting employment now is lack of demand for the things workers produce. Their incentives to seek work are, for now, irrelevant.”

One way I tested, and rejected, the Keynesian assumption was to compare work-incentive changes and work-hours changes between 2007 and 2010 across 10 demographic groups differentiated according to their skill (five categories) and marital status (two categories). In the Keynesian view, the two changes would be correlated only by coincidence.

The group-specific incentive changes are measured (most recently in my paper “Recent Marginal Labor Income Tax Rate Changes by Skill and Marital Status“) on the horizontal axis in the chart below as percentage changes in the share of what people keep from what they earn, net of taxes paid and subsidies forgone. For example, work incentives were eroded about 20 percent for unmarried household heads (red squares) in the middle of the skill distribution, while they were eroded about 12 percent among married heads and spouses (black circles) with the same level of skill.

The vertical axis of the chart measures the percentage change in hours worked per person, most of which is due to increased unemployment rates. Each tick on the vertical axis is 2 percent, which makes each tick as large as some recessions.

Among unmarried people, hours worked tended to fall more for the less-skilled groups. I explain this result as a consequence of greater incentive erosion among less-skilled unmarried people compared with more-skilled unmarried people, but others have suggested that less-skilled people experience greater demand changes during recessions or otherwise have behavior that is more sensitive to economic conditions.

Remarkably, the same skill pattern does not hold up among married people. All but the top skill group have essentially the same hours changes and are uniform in terms of their incentive changes. Also remarkable are the huge differences by marital status between hours and changes and incentive changes. For example, the married people in the lowest skill group saw their work hours fall about half of the drop for unmarried people with the same skill, which lines up with the huge difference in their incentive changes.

Keynesians can explain different labor-market experiences by demographic groups to the degree that groups differ in their propensities to work in declining industries, except in this case marital status has very little correlation with industry of employment. All of this makes sense to economists who think that labor supply still matters, because groups facing the same demand for their labor can nonetheless have different labor-market outcomes because of their varied supply situations.

The fact that marginal tax rates rose so differently for various groups means not only that redistributive public policy depressed the labor market but has also sharply, and arbitrarily, altered the composition of the work force in the direction of people who are married and more skilled.