Wednesday, December 31, 2008

Want to Cut Your Debt? Work Less


Mortgage modification programs create terrible work incentives and are ubiquitous these days, and this is one reason why this recession is so different from previous ones.

In most cases, a homebuyer takes out a mortgage that covers only part of the value of the house he’s buying. In other words, the house a person buys is worth more than the mortgage he owes on it. This means that in the event of borrower delinquency, the lender can, in most cases, obtain his full principal by foreclosing on the house and selling it to a new purchaser.

However, housing prices have fallen dramatically since 2006. By 2008, about 12 million mortgages were “under water” – meaning that market value of the house had fallen below the amount owed on the mortgage. Because of the low resale values, foreclosing on any of those homes will not yield lenders their entire principal; lenders in those cases must rely on the good behavior of the borrowers.

Officials at the Federal Reserve, the United States Treasury, the F.D.I.C., Fannie Mae (most recently, its “Early Workout” program) and Freddie Mac have encouraged lenders in such cases to “modify” mortgages – that is, to accept a stream of payments from the borrowers that is different from the amounts promised when the mortgages were initially signed. In particular, these “modification programs” encourage lenders to reduce mortgage payments so that each borrower’s housing payments (including principal, interest, taxes and insurance) are 38 percent of the borrower’s gross income. The payments are to be reduced for the next five years, or when the mortgage is paid off (whichever comes first).

Of course, a borrower cannot be harmed by the opportunity to have his mortgage payment reduced. But what is economically noteworthy is that the amount of the payment reduction depends on the borrower’s income – the less he or she earns, the more the payment is reduced. For example, a borrower whose annual family income is $100,000 can have her housing payments reduced to $38,000 per year, whereas a borrower whose annual income is $50,000 can have his payments reduced to $19,000 per year.

One implication of the mortgage modification rules is that a family that earns $50,000 less in the year prior to their modification stands to save $19,000 per year for the following five years – or a total of $95,000 on its housing payments! Those are 95,000 reasons to hesitate when looking for a new job, when wrapping up a maternity or paternity leave, or when confronting other job transition situations.

I do not expect every adult among those in the 12 million underwater households to be without a job because of the modification rules. Although modification professionals have specialized in educating homeowners about their modification options, many homeowners probably do not fully understand the mortgage consequences of their earning decisions. Nobody knows the exact numbers, but, even if 90 percent of homeowners were oblivious or uninterested in their modification options, that would leave over a million households that were aware. One million plus workers would make a large dent in the employment statistics.

My previous post reminded readers that productivity has been rising and employment falling in this recession. If approximately one million workers realized that earning income in 2008 was not in their financial interest – and acted on this realization – their actions would have the effect of significantly reducing aggregate employment and hours. As businesses operated with less labor, labor productivity would rise. Maybe the housing crash and mortgage modification that followed have something to do the recession of 2008.

Monday, December 29, 2008

Monthly Productivity

These days Q3 seems like ancient history, so I took a shot at forecasting Q4 productivity from the monthly data. In particular, I took personal income and deflated by the PCE-deflator and the BLS's monthly aggregate hours index. I formed a quarterly dataset:
  • BLS hourly productivity for the quarter -- released early in the next quarter

  • hourly real personal income (that is, personal income deflated as explained above) averaged for the first two months of the quarter -- available in the last month of the quarter

For the years 2000-8, I regressed log BLS productivity on its lag, a linear time trend, and the log of the personal income variable for the first two months. The last variable had a positive, economically significant, and statistically significant coefficient. That is -- if this relationship holds up -- today we can expect Q4 BLS productivity (not released yet) to be higher because hourly personal income is high for Oct and Nov.

Here is a graph of the two series since 2005. The graph is monthly, so the BLS productivity measure is centered on the middle month of the quarter. The last 3 personal income data points are September (part of Q3), Oct (Q4), and Nov (Q4).


Here's a version with transfers subtracted out of personal income.


Sunday, December 28, 2008

Look What Supply and Demand Can Do!

I have taken merely two measurements -- -0.047 (the log change in aggregate work hours from end of 2007 to end of 2008) and +0.009 (an estimate of the log change in labor productivity over the same time frame) -- and the Cobb-Douglas derived demand function, and arrived at SEVEN conclusions:

Is there ANY other framework that is even HALF that powerful? Game theory? Behavioral economics? Commenters -- give it your best shot!!


No methodology can be stronger than the data to which it is applied. I am watching the Q4 productivity number closely. I (and, implicitly, the GDP forecasters) do not anticipate a huge productivity decline. But if productivity did decline at a 10 percent annual rate Q3-Q4 or a 5 percent annual rate Q3-Q1 (that's a LOT), then this recession would look more like the previous ones, although even in that case the productivity decline would have come surprisingly late.

Saturday, December 27, 2008

How Does Public Spending Stimulate?

Will additional government spending "jump start" the economy? We cannot answer this question without some understanding of how fiscal policy works.

In order to explore this question without assuming the answer from outset, I consider two mechanisms: intertemporal substitution and increasing returns.

INTERTEMPORAL SUBSTITUTION

This is Barro's approach. It says that a temporary increase in public spending crowds out contemporaneous private consumption and investment. Thus, there is no public spending multiplier -- public spending cannot increase GDP MORE than the amount of public spending itself. Public spending does increase GDP because it also crowds out leisure, but it reduces private spending.

This seems to fit the historical data: public spending does seem to reduce private spending.


INCREASING RETURNS

Believers in a public spending multiplier have not been terribly specific about how this works. If I had to formalize their view, I would use some kind of increasing returns. That is, the benefit from working occasionally is GREATER when others are working more. A leftward shift in the labor supply of some persons thereby reduces labor productivity of the others, which causes others to work less.

The question is -- when is the economy in the range of increasing returns? That is, when will (increased) reduced employment (increase) reduce productivity? Arguably there are a number of recessions (including the Great Depression) when reduced employment harmed productivity. In these cases, we might expect that public spending would raise private sector productivity and thereby raise employment by firms that make private consumption and investment goods.

I blame the believers in public spending multipliers for failing to supply us with more details about how the increasing returns works, because this knowledge would help a lot for targeting the public spending in a way that maximized the likelihood that the increasing returns were exploited. However, in this recession this question is moot.

In THIS recession, productivity is HIGH despite the reduced employment. That is, employment seems to have affected productivity exactly as we would expect if there were DIMINISHING returns (that's the Cobb-Douglas model I wrote about yesterday). Thus, even if I could be guaranteed that public spending would be well-timed in this recession AND public spending had a multiplier in previous recessions, I remain doubtful that public spending will have a multiplier in this recession.

We have to accept that, these days, public spending will crowd out private spending.

[Added: I view "increasing returns" as another way of saying "chain reactions" or "coordination failures." That is, if it were so important to work when others do, then why isn't productivity of today's workers lower because of the 2 million workers that left over the last year? I realize that there are "other things going on", but if the "other things" dominate increasing returns in determining productivity, then why wouldn't the former also dominate in determining the fiscal multiplier?]

Friday, December 26, 2008

Labor Market Distortions are Real

Some of the commenters have put up a "perfectly efficient markets" straw man as an argument against the use of supply and demand to understand today's economy. It is probably my fault for not previously elaborating on this point.

I think there are many distortions in the labor market. See, for example, my A Century of Labor-Leisure Distortions or my Public Policies as Specification Errors. Supply and demand continue to be useful in this setting, as long as you recognize that multiple prices exist in the marketplace.

Suppose, for example, that a distortion existed because of an inefficient intermediary. For example, the price of oil might be $50 in Illinois, but $45 in Texas, because oil comes from the Middle East to Illinois via Texas. We can still talk about supply and demand for oil in Illinois. We just have to be careful that the supply of oil to Illinois embodies more than just the behavior of Middle East oil producers and trans-Atlantic shippers -- it also involves the behavior of the Texas intermediary. Or we might analyze the demand for oil from the Middle East, in which case we have to recognize that it is not just Illinois behavior, but Illinois behavior is intermediated by the Texas middle-men. So the Texas middle man appears on the supply side in one analysis, and on the demand size in the other.

Now back to the labor market. None of my posts refer to "wages" -- that is intentional. I refer to PRODUCTIVITY. This means that a whole bunch of things in the labor market appear on the supply side! That includes everything from sticky wages to employer taxes to (hypothetically -- don't lynch me!) worker laziness. You might say that makes the analysis without content because it has an excessively narrow concept of demand -- it might in principle but in practice it has enabled me to distinguish this recession from several others -- other recessions did have labor demand reductions, even under my narrow definition.

One commenter said that bad employer incentives (I guess an employer tax would fit in that category) have to be considered "demand". That comment is incorrect if the analysis treats, as mine does, the "price" as productivity. In my analysis, a payroll tax owed by employers would properly appear on the supply side of the labor market.

IMPLICATIONS FOR "PRODUCTIVITY WEEK"
Because I have put a variety of behaviors on the supply side of the market, the productivity and employment numbers by themselves do not tell us whether sticky wages, employee preferences, bad working conditions, taxes, or some other factor outside the production process caused the "Labor Supply Shift of 2008." The next phase of the analysis is therefore to investigate some of the specific distortions (get a preview of this here, here, here, here, here, here, here, here, and here.

Could Real GDP Rise in Q4?

I think that the forecasts of real GDP growth rates Q3-Q4 of -5 to -6 percent (annualized) are too pessimistic. However, might real GDP actually grow Q3-Q4?

PRODUCTIVITY ANGLE
We have employment and hours numbers for Oct and Nov already saying that aggregate labor hours growth Q3-Q4 (annualized) will be -7 to -8 percent. That means that real GDP growth requires total factor productivity (this is different from hourly productivity I have discussed in previous posts -- TFP is how much GDP would grow if labor were constant) to increase 5 percent or more. That's more than the trend productivity in the recent past, so the odds must be less than 50%.

Productivity growth (for one quarter, at annual rates) has been 5% or more during previous recoveries. It happened two quarters in a row starting 6 quarters after the start of the 1981-82 recession. It happened 4 quarters after the start of the 1990 recession, and again 3 quarters later. It happened 3 times in the year following the start of the 2001 recession. Interestingly, the 2001 recession was a recession with very little quarter-to-quarter productivity decline (this recession has none). This tells me that the odds are not negligible.

Also note that there was a major hurricane and a strike in Q3, which were gone by Q4. This by itself would create a bit of productivity growth.

PERSONAL INCOME ANGLE
I am confident that personal income deflated with the CPI will be higher in Q4 than in Q3, given that it is already so much higher in Oct and Nov than it was in Q3. The GDP deflator tends to be less volatile than the CPI, so personal income deflated by the GDP deflator will likely grow less. However, given that Oct and Nov NOMINAL personal income are a bit higher than the Q3 average and that the GDP deflator will fall Q3-Q4 (albeit less sharply than the CPI), it seems that personal income deflated by the GDP deflator will grow Q3-Q4 about 1 percent = 4 percent annualized.

From this perspective, the question is whether GDP could grow one percent (4 percent annualized) less than personal income. The differences between GDP and personal income include depreciation, retained earnings, net factor income paid to foreigners, and bunch of public sector items (plus estimation error in going from monthly to quarterly). Personal income is about 85% of GDP, so the residual between them would have to shrink by 7 percent (= 28 percent annualized) in order for GDP to grow 1 percent less than personal income. This another reason why I see a significant likelihood that real GDP growth Q3-Q4 is closer to real personal income growth, and thereby positive.


MY FORECAST
My point estimate for real GDP growth Q3 to Q4 is -2.5% (annualized rate). I get this by assuming that TFP follows trend (about 2% annualized; remember that I see that not much is happening with labor demand) and that labor falls 7%. 2 - (7 * labor's share) = -3. Then I add a little because personal income has done surprisingly well in November.

[some hand waving ...] Probability (real GDP Q4 higher than real GDP Q3) = 0.33. Probability (real annualized GDP growth Q3-Q4 < -5%) + .25. That is, the consensus forecasts are too pessimistic, but not impossible.

Monthly Consumption Growth: Highest in 7 years!

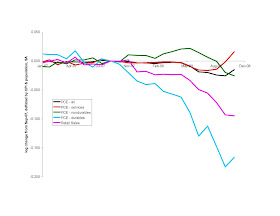
I mentioned that the Dec 24 BEA report showed a strong increase in real personal income. Now I notice some interesting patterns with real per capita consumption expenditures from the same report.


The "disaster" here seems to be isolated to durable goods. Of course, we are nauseatingly aware of the automaker woes. But real services (over 60 percent of total consumption expenditure) are actually higher.

The news from Wednesday (ignored, of course, by the press) is that:
  • per capita consumption expenditures (all types, deflated by CPI-all) were up in November for the first time since April. This is the largest monthly increase in more than seven years.

  • per capita durable consumption good expenditures (deflated by CPI-durables) were flat in November

  • per capita services expenditures (deflated by CPI-services) were up in November, for the 20th month in a row

  • per capita retail sales (deflated by CPI-all) were pretty flat in November, after 5 straight months of losses

Do we dare entertain the idea that the trough of this recession was in October?

[technical note: I used the CPI for all items to deflate retail sales and PCE - all. The CPIs for durables, nondurables, and services, respectively were used to deflate the components of PCE. I think this is the right approach, but in case you want to see the consumption series deflated with a common deflator (CPI-all), see below. I infer from the monthly inflation rates (Oct-Nov) that fuel costs appear in nondurables: -1.7% (all), +0.0% (durables), -5.1% (nondurables), -0.6% (services) . More on deflators below.]


[added: Today it was reported that

  • nominal Dec retail sales are down 5.5-8 percent compared to the same time frame last year. This is a different data source than I used above -- so we have to be cautious with comparisons -- but note that the retails sales data I used have a Nov-Nov change in nominal retail sales of -5.9 percent.

  • amazon.com had the best holiday season ever.

So today's data is consistent with the expectation that December's consumption will be as strong as November's.]

[Added Dec 27: Thanks Tegwar for pointing out that the BEA has monthly PCE deflators. The graph below uses them. The news items based on the various PCE deflators are:

  • per capita consumption expenditures (all types, deflated by the PCE-all deflator) were up in November for the first time since May. This is the largest monthly increase in two years.

  • per capita durable consumption good expenditures (deflated by PCE-durables deflator) increased in November

  • per capita expenditures (deflated by category-specific PCE-deflator) were up in November for all three consumption categories

  • per capita retail sales (deflated by PCE-all deflator) were pretty flat in November, after 5 straight months of significant losses

Rising Productivity with Falling Employment

Everyone seems to think it is so easy to explain why productivity can rise when employment falls. It is -- IF labor demand is stable. The observation that "marginally" productive workers are the first fired is exactly what it means to move ALONG the labor demand curve.

The real question is how do you modify your prediction for the previous severe recessions -- when productivity FELL?! Here's what I say: that's when demand shifted more than supply.

This is why I have spent a whole week asking: why does the labor demand curve shift so little in this recession, and so much in previous (severe) ones?

Thursday, December 25, 2008

Wednesday, December 24, 2008

Economics Lesson from the University of Chicago’s U.S. Senator

Copyright, The New York Times Company.

President-elect Barack Obama was not the first University of Chicago professor to serve in the United States Senate. More than 50 years prior, a professor from my department named Paul Douglas became a United States senator representing Illinois.

In his life as an economics professor, Professor Douglas wrote about the supply and demand for labor. Some of his techniques can lead us to a surprising conclusion about today’s recession: The recent decrease in employment may be less due to employers’ unwillingness to hire more workers, but more to workers’ unwillingness to work.

As you’ve probably heard, employment has been falling over the past year. After peaking in December 2007, employment fell 1.4 percent over the next eleven months. Hours per employee were down, so that total hours worked were 4.7 percent below its upward trend over the prior 36 months. Explanations for the decline — like most everything in economics — can be classified in two ways: supply or demand.

In many recessions, the demand for labor gets much of the blame. The demand explanation says that, with orders for their products down, many employers have trouble finding productive uses for their employees. Some employees are then let go. In this view, productivity – the amount produced per hour worked – should decline because reduced productivity is one of the driving forces of layoffs. Gross domestic product thereby declines for two reasons: fewer workers and less productivity per worker.

Indeed, hourly productivity did decline in the 1981-82 recession, falling three of four quarters for a cumulative peak-to-trough decline of 2.3 percent. Productivity fell faster and longer during the Great Depression.

The second type of explanation is reduced labor supply.

Suppose, for the moment, that people were less willing to work, with no change in the demand for their services. This means that each worker who remains employed would have to be more productive because employers have to produce with fewer workers.

Of course, people have not suddenly become lazy, but the thought experiment gives similar results to the actual situation in which some employees have bad incentives to take jobs and some employers have bad incentives to create them.

Professor Douglas gave us a formula for determining how much output per work hour would increase as a result of a reduction in the aggregate supply of hours: For every percentage point that the labor supply declines, productivity would rise by 0.3 percentage points.

As mentioned above, in 2008, labor hours have fallen 4.7 percent below trend. According to Professor Douglas’s theory, this means productivity should rise by 1.4 percent above trend by the fourth quarter.

So let’s take a look at the numbers. Unlike in the severe recessions of the 1930s and early 1980s, productivity has been rising. Through the third quarter of 2008, productivity had risen six consecutive quarters, with an increase of 1.9 percent over the past three, or 0.7 percent above the trend for the prior twelve quarters.

Because productivity has been rising – almost as much as the Douglas formula predicts – the decreased employment is explained more by reductions in the supply of labor (the willingness of people to work) and less by the demand for labor (the number of workers that employers need to hire).

Why would some persons have worse incentives to take jobs (and employers worse incentives to create them) in 2008 than they did in 2006 or 2007?

I will tackle that question in my next [New York Times] post, but even without a specific answer we learn a lot about today’s recession from the conclusion that labor supply – not labor demand – should be blamed. First of all, it suggests that a fundamental solution to the recession would encourage labor supply (perhaps cutting personal income tax rates, so people can keep more of their wages), rather than tinker with demand.

Second, the recent supply reduction may be more short-lived than the demand reductions of past severe recessions. In particular, as people adjust to the reality of depleted retirement accounts and vanished home equity, many of them will decide to make up for some of the shortfall by working more and retiring later.

On another note, the Department of Economics at the University of Chicago does not conform to stereotypes: Professor Douglas ran for senator on the Democratic Party ticket and was occasionally accused of being a socialist. I teach his formula frequently and with admiration.

Real Personal Income is Higher than Ever

[all of the statistics below are seasonally adjusted by the BEA or BLS]

Today the Commerce Department released its estimate of November nominal personal income, 12.1638 trillion dollars (at annual rates).

ECONOMICS 101: DIVIDE BY CPI
The press is emphasizing that the figure is 0.2 percent less than in October. But let's not forget that the BLS reported that consumer prices were down 1.7% over the same time frame. That means a real personal income INCREASE of 1.5% in just one month!

We can argue about how exactly to deflate, but no resolution of that argument is going to change this 1.5% gain into a measure that screams disaster.

I'm not sure why the Commerce Department does not report real personal income, although at the bottom of its report it does show real disposable personal income, which was 1.0 percent HIGHER in November than in October. That's their calculation -- not mine -- so don't blame me from ruining your "economic disaster" parade.

Today's Commerce Department shows data back to April: over that time frame, personal income deflated by CPI was highest in November. I am pretty sure that makes November higher than ever!

REAL PER CAPITA
If you like things in per capita terms, November real personal income (at a monthly rate) was $3311.61 per person. That's the second highest ever, with the first highest being $3311.79 per person in May. That's right, we missed the real per-capita record by 18 CENTS per person. Enough said!

GUESS AT Q4 REAL GDP
The experts are saying that real GDP (at quarterly rates) will be more than 1 percent lower Q4 than Q3. Are any experts reading this? Can they explain to us why they have that expectation, given that October real personal income (quarterly rate) EXCEEDED the Q3 real personal income by 1.2 percent and November EXCEEDED it by 2.8 percent? Are you predicting that real personal income will fall more than 10% in just one month, in order to bring the Q4 average down that far? Or are you predicting a huge departure between the growth rates of real personal income and real GDP?

I am admittedly an amateur at high frequency forecasting (it has less to do with the basic economic forces I have been emphasizing, which may take a couple of quarters to work out), but there are enough significant inconsistencies with the experts' forecasts that I have to issue my own:
  • Q4 real (and seasonally adjusted) personal consumption expenditure will fall less Q3-Q4 than it did Q2-Q3.
  • Q4 real (and seasonally adjusted) GDP will fall less than 1.0% (that is: less than 4.0% at annual rates) Q3-Q4, and may rise.
  • Q4 labor productivity will be higher than Q3's (that is, productivity growth Q3-Q4 will not be negative).

The So-Called Participation-Hours Dichotomy

Here's a peek at some (no so pretty) Chicago Economics department politics. Coleman wrote a dissertation at Chicago in the 1980s saying that most of the business cycle was on the "extensive" or "participation margin" rather than the "intensive" or "hours margin." Professor Heckman wrote that this was one of the important lessons in labor economics.

I disagree. Participation and hours, as usually measured, are hardly conceptually distinct. Nor do my calculations for previous business cycles show the stark contrast that Coleman's did.

For this recession, hours per employee per week seem to have fallen in about the same percentage as the number of employees.

The so-called participation-hours dichotomy is much ado about almost nothing. Let's just say that labor supply slopes up and get on with it.

[The sometimes important issue of imputing wages for persons who do not work (and times not worked within person) is often confused with the supposed conceptual distinction between participation and hours. I explain here why we should not confuse these].

Tuesday, December 23, 2008

Supply-Demand Accounting for the 2008 Recession

Let's look at labor quantities and productivity now and at the end of 2007 (when employment peaked and NBER says that the recession started):
  • From Dec 2007 to Nov 2008, aggregate hours are down 4.7 percent relative to the trend for the prior 36 months

  • From 2007 Q4 to 2008 Q3, productivity per hour is UP 1.9 percent, or 0.7 percent above the trend for the prior 12 quarters.

  • Productivity numbers are not in yet for 2008 Q4, but let's suppose that (as compared to 2007 Q4) they are 0.9 percent above trend (that is, continuing the pattern of the prior three quarters).

The graph below is a supply and demand representation of the situation, based on the assumption that labor demand has an elasticity of -0.3 --> with stable labor demand, a 4.7 percent labor reduction would be associated with a 1.4 percent labor productivity increase.


We see that Dec 2008 is explained mainly by a supply shift. The magnitude of the supply shift is not unusual as recessions go. The lack of a significant demand shift is.

I expect that economists and others will find this conclusion very controversial, even though this is exactly the kind of accounting that Murphy and Katz did on their well accepted paper on the skill premium. Indeed, their method is better applied here because we know more about the aggregate labor demand elasticity than we do about the cross-skill elasticity of substitution in production.

[Technical Note: I stretched the price axis for the purposes of illustration. If drawn to scale, the demand shift is even smaller relative to the supply shift than shown above. Assuming that labor demand follows Cobb-Douglas with 0.7 labor's share and the elasticity of labor supply is less than 2, then more than 90 PERCENT of the reduced quantity of labor is due to a labor supply shift.]

Flight to Quality -- Cause or Effect?

Professor Lucas is a strong advocate.

I agree that there is a flight to quality. Professor Lucas says that one way that people attempt to buy safe securities is to spend less on consumption goods. That makes sense -- but the same logic implies that people should work harder (earn more) as another means to accumulate those securities. The facts show that people are working less. Barro and King (1984) explained it best -- the basic puzzle of recessions (this one included) is that consumption and leisure move in opposite directions. Wealth effect and intertemporal substitution effect explanations of recessions (Professor Lucas' story is one example) imply that they move together.

That's why I believe that the "flight to quality" is a symptom rather than a cause.

Professor Lucas arrives at the conclusion that the Fed should print money. Despite the arguments above, I agree that such a Fed policy would do more help than harm.

GDP Revision: Productivity Perspective

The Commerce Department regularly updates its national accounting estimates. Today they reported that GDP fell 0.5% at an annual rate 2008 Q2 to 2008 Q3, which is the same as it had previously estimated for that time period.

Employment fell 1.1 percent at an annual rate over the same time period. Aggregate hours worked fell 2.2 percent at an annual rate over the same time period. With GDP falling less than labor, we conclude that productivity was rising -- despite the Boeing strike and the major hurricane that occurred in Q3.

Mankiw's Teaching on the Fiscal Stimulus

Professor Mankiw explains it well here. Now I understand why his textbook passes the market test!

Monday, December 22, 2008

A Labor Market Tautology

By the NBER definition, a recession occurs when employment falls.

Employment falls when either labor supply shifts to the left, or labor demand shifts to the left, or both [for these purposes, "labor supply" includes any labor market distortions, such as income taxes and minimum wages]. This is a tautology -- it is true regardless of what is the "right" model of the economy, and regardless of what really caused the recession.

Thus, it is no surprise that recessions tend to have (a) negative productivity growth and (b) leftward shifts of the labor supply curve. The former is related to labor demand and the latter to labor supply. If we just focus on employment reduction events, it is no surprise that the average event has both reduced labor supply and labor demand.

What would be VERY interesting is a recession that occurred with only ONE of these changes. The prototypical real business cycle featured productivity shocks and a stable labor supply function (more precisely, a labor supply function that shifted ONLY due to wealth or intertemporal substitution effects) -- in other words a real business cycle recession is one in which the reduction in employment is largely blamed on labor demand. That is why commentators on (critics of?) the real business cycle model have repeatedly illustrated that employment fluctuations have to be explained in part by labor supply shifts (Barro and King, 1984; Hall, 1997; Mulligan 2005), and not just productivity shocks.

This recession may be one of the first ever that can be explained by ONE of those changes. But, contrary to prototype real business cycle, the ONE change is in labor supply without much reduction in labor demand. The basic methodology of real business cycle theory may apply well to this recession -- as long as we put the shock on the labor supply side of the market and hold productivity constant.

Labor Productivity Week

This week I have a several blog entries on productivity and employment. Wednesday's entry will be shown on the New York Times Economix Blog. Plan A is that I will continue to make Wednesday entries there.

Labor productivity tells us a lot about what is happening in the U.S. economy right now.

Inflation article in yesterday's Tribune

Click here.

IMO, it somewhat overstates the benefits, but I agree in spirit. The article is exactly right that inflation is the only housing price stimulus plan that would not add further to the housing glut.

Sunday, December 21, 2008

Ford's Sentiment Tells All

Of the big 3, Ford is said to be the most solvent. Does Ford want its weaker competitors to fail or survive?

In many industries, each producer fantasizes that some of his competitors would go out of business. With their failure, the surviving producers can raise prices, cheaply acquire assets for expansion, and negotiate better deals with firms that supply inputs to the industry.

Notably, Ford has (apparently) not aspired for failures by GM or Chrysler and the aforementioned advantages that would accrue from their failures. Ford has actively participated in the lobbying efforts and -- aside from sending their CEO on the first DC trip in a private jet -- have missed many opportunities to sabotage the bailout.

This fact tells us a lot about the bailout's impact. Ford must believe that a bailed out GM and Chrysler would charge higher prices than would the manufacturer(s) who would serve GM and Chrysler customers after they failed. It's easy to see why Ford might believe this: a GM or Chrysler failure would break union contracts with those two manufacturers. Ford would still be tied to its contract as long it remained solvent, and thus would find itself competing with unionless manufacturers. Ford would benefit by a bailout of its competitors because the bailout would prevent its competitors from reducing costs.

If the Bush administration were loyal to the consumer, it would have asked Ford what kind of bailout Ford wanted for GM and Chrysler -- then did the opposite! In fact, the Bush administration did pretty much what Ford wanted, and thereby revealed its loyalties.

Friday, December 19, 2008

Our Weird Recession

Professor Nunes kindly sent me his illustration of productivity growth for past recessions (I believe that these are the percentage growth rates from the quarter indicated to the quarter one year prior). Productivity growth is usually negative in recessions. He shows the recent recessions as exceptions, although those recessions also show some negative quarter-to-quarter productivity growth (not shown below) -- today's doesn't (yet).

Thursday, December 18, 2008

Productivity is Still Growing

It looks like employment will be one percent lower in 2008Q4 than it was in 2008Q3. There is not much uncertainty about this, because October and November employment are already known.

Work hours per employee will also be lower -- maybe also about one percent. Thus, total work hours will be 1-2 percent lower, probably closer to 2 percent.

Productivity growth is the percentage change in GDP minus the percentage change in total work hours. I have seen forecasts that GDP 2008Q4 will be 1.25 percent lower than for 2008Q3. Thus, the forecasts imply further productivity GROWTH. Productivity also grew 2007Q4 through 2008Q3 (about 1.9 percent). The fact that we are having a recession while productivity is growing tells us a LOT about why we have a recession, and why it is so different from the 1981-82 recession or the Great Depression. More on this over the next week....

For those 136 million who still have jobs, productivity growth is VERY good news because productivity determines how much you ultimately get paid.

Tuesday, December 16, 2008

I'm Glad that Gas is Cheaper

The CPI fell 1.7 percent between October and November. That's a lot -- if that continued for 12 consecutive months, the annual inflation rate would be -18 percent!

However, essentially all of the drop was reduced energy prices. As a net oil importer, the U.S. is better off when oil is cheaper relative to the goods that we produce.

Nevertheless, I would like to see the Federal Reserve take bigger steps to keep INflation going. Inflation will alleviate some economic problems; prolonged deflation will aggravate them.

Monday, December 15, 2008

Will Today Live in Infamy?

Today the Streamlined Modification Program, sponsored by Freddie Mac, Fannie Mae, and other federal agencies, goes into effect. It modifies mortgages so that the monthly payments are no more than 38% of borrower income. In other words, borrowers with more income have to pay more; borrowers with less income have to pay less. Indeed, a borrower that is able to earn $1000 extra on his own may, as a result of earning it, ultimately add more than $1000 to his mortgage payments.

This is a sure-fire recipe for removing the incentives for people to work and earn income and thus an effective way to REDUCE employment in the economy.

Until recently, the agencies and a number of banks were modifying mortgages for delinquent borrowers (about 10 percent of mortgages are either delinquent or in foreclosure). "Fannie Mae announced [last] week that homeowners who make their mortgage payments on time but who are struggling financially will be eligible for mortgage modification." (quote from USA today, referring to a December 8 Fannie Mae announcement). This WIDELY expands eligibility and thereby widely expands the reach of these awful incentives.

Friday, December 12, 2008

U.S. 2008: Richest Year in World History?

It is very likely that the U.S. will have the most real GDP per capita in its history in 2008, despite the fact that the entire year will be spent in recession (by the employment definition).

Cross-country comparisons are not easy, and oil countries have had some very good years, but arguably the U.S. has the most GDP per capita in the world. U.S. 2008 might be the richest year in world history thus far!

Remarkably, one can have a reasoned debate as to whether U.S. 2008 was the richest in world history, but at the same time the news media characterizes 2008 as a year of "economic disaster"! Well, I'd rather have this "disaster" than, say, going back to 2004 GDP per capita.

Could it be that declarations of disaster are used as an excuse to steal our tax dollars?

CALCULATIONS
2007 GDP (chained 2000 $) was $11,524 billion. 2007 population (July) was 301,621,157 --> real GDP per capita was $38,207.

Through Q3, 2008 GDP was $8,771 billion (seasonally adjusted by the BEA). 2008 population (July) was 303,824,640 --> 2008 produced $28,870 per person already through Q3. That means only $9,338 per capita ($2,837 billion in aggregate) needs to be produced in Q4 to break the 2007 record. In other words, if Q4 is within 3 percent of Q3, we break the record. Even the most pessimistic forecasters admit that Q4 real GDP will be greater than that.

[added: there is plenty of room to debate whether a couple of oil countries were momentarily richer (per capita) than the U.S. My point: the fact that you can debate these things shows that "disaster" is not an accurate description of 2008]

Thursday, December 11, 2008

Don't Blame Greenspan

I attribute the housing boom to optimism (whether it was warranted is another story). Others blame Greenspan. See a debate on this topic here.

Mortgage Modifications' Implicit Tax

Mark Lieberman of Fox Business News has an article about the feedback effect of mortgage delinquencies on unemployment.

I spoke to Mr. Lieberman, who explained to me how he used to work for a bank. He explained that it was common banking practice in previous recessions to modify mortgages according to borrower income. So maybe my theory applies not only to 2008 and 1933, but also a number of recessions in between?!

Tuesday, December 9, 2008

Please Remember Neglected Children During the Holidays

The theory of supply has been severely neglected this year. Read here where I beg Professor DeLong to remember supply.

Wow! Crook County Fitzmas

The Democratic Party enjoys quite a monopoly in Cook County. I am glad to see that the U.S. Department of Justice is doing something to prevent the party from charging us citizens too much.
  • Rostenkowski stole postage stamps.
  • Ryan stole drivers' licenses.
  • Blagojevich allegedly stole a Senate seat.
What's next?!
[added: some Nixon fans say that Mayor RIchard J. Daley stole the presidency]

Hindsight: Taxpayers ripped off?

The AP reports that the preferred shares of banks purchased by the Treasury have lost $9 billion in value already. On the surface, it would seem that taxpayers over-paid.

However, I have explained earlier that taxpayers are among bank shareholders, and the Treasury funds went straight to those shareholders. In hindsight, those lucky shareholders received a good price for the stock they sold to the Treasury.

This is not a situation where taxpayers were ripped off, but rather a situation where some taxpayers got a bad deal and others got a good deal. Moreover, if you are among the former it is your own fault, because you could have sold bank shares when the Treasury was buying.

disclosure: long XLF

Monday, December 8, 2008

When Will Housing Construction Resume?

Housing construction will resume when housing prices are anticipated to be at or above construction cost for the duration of time it takes to build a house.

OK, when will housing prices be anticipated to be at or above construction cost for the duration of time it takes to build a house? That will occur when the demand for housing is expected to exceed the current stock of housing. The U.S. stock of housing, measured in year 2000 prices, was $12.9 trillion at the beginning of this year. If demand continued to follow the trend of the 1990s (a period without a housing boom), the demand for housing at year 2000 prices would have been $12.6 trillion at the beginning of this year. In other words, we need a sustained demand increase of 3 percent in order for the houses we have to be worth construction cost.

During the 1990s, demand increased an average of 0.2% per month (2.4% per year). At that pace, demand would reach $12.9 trillion (today's housing stock) by April 2009. Below is a chart showing actual housing and 1990s trend housing. Notice from the chart that the trend exceeds this year's actual value before the beginning of 2010.


If demand returned to the 1990s trend, there a couple of reasons why housing construction could resume sooner than April 2009. First, some of the housing built during the 2000s boom may have been built in the wrong places, so the current housing stock is over-valued at year 2000 prices. Second, although in hindsight we can say that housing demand that was high enough to sustain boom time prices never materialized, housing demand might still have increased beyond the 1990s trend (that is, the housing boom was exaggerated but based on something real, wasn't it?). Third, houses are depreciating for the usual reasons, plus some additional neglect due to the foreclosure process.

Of course, we are in a recession and a financial crisis now, which may reduced demand below the 1990s trend. Also, the actual stock has not been frozen at $12.9 trillion because a bit of building has occured this year. I expect the size of this demand reduction and the contribution of year 2008 construction to be small, and therefore expect to see housing construction resume next summer, if not earlier.

EPILOGUE: WHEN WILL HOUSING PRICES RETURN TO BOOM LEVELS?
Boomtime housing prices were much above construction cost, and therefore much above where I expect them to be next summer. It will take either general inflation or another housing boom for housing prices to return to boom levels. I and some other economists have recommended some inflation, but if that recommendation is not followed and inflation rates continue in the 2-5%/year range, it will take a number of years for housing prices to return to what they were in 2005 or 2006.

Sunday, December 7, 2008

This Week's Employment and Productivity Reports and the Outlook from Here

In October I predicted that U.S. nonfarm payroll employment would never fall below 134 million (a level that would make this recession almost as deep as 1982). This prediction still makes sense to me, even though I did not anticipate that the Treasury and the Fed would themselves contribute to labor market damage.

Friday's employment report put nonfarm payroll employment at 136 million, having fallen 0.5 million in a month. Thus, I am predicting that we will not have four consecutive months like last month.


Productivity is what ultimately determines employment, and that looks good so far. On Thursday we learned that output per hour grew at 1.3% (annual rate) from 2008 Q2 and Q3, which is similar to the overall pace for 2007 and exceeds the pace for 2006. For the entire calendar year 2008, it looks like productivity will have grown more than it did for either of the prior two calendar years. By comparison, productivity growth was NEGATIVE in 1982 and (according to Cole and Ohanian) in EACH of the years 1930-33.

You may have noted the contrast between this year's employment performance and GDP performance. When productivity grows, output can grow even while employment falls. We are in a recession (and have been since late 2007) by the employment definition (NBER uses this) but not yet by the GDP growth definition. We likely will finish 2008 with more GDP than in any year in history, yet less employment than in 2007. The GDP and productivity performance is quite different from "severe recessions." What is severe about the 2008 economy is the news coverage, and the assault on the taxpayer!

Saturday, December 6, 2008

Mortgage Arithmetic Behind Tribune Article

Some Tribune readers asked to see some arithmetic. I posted some mortgage arithmetic here in an Excel spreadsheet.

Although this example shows that you would actually have LESS money to spend if you found a job quickly, please note that this is not the entire point. The point is that a large fraction of the money you generate by working goes to the bank. That's why its like a tax: earn more = pay more to bank; earn less = pay less to bank. Yes, a person paying a 50% tax can spend more if he works more. But he has half the incentive to work than he would have if he paid a 0% tax.

In a normal situation, your decision to work has nothing to do with what you pay the bank. You either pay in full or give up your house, regardless of how much you work and earn. But 2008 is not a normal situation.

Homeowners are No Dummies

I expect homeowners to take deliberate steps to make themselves more forgivable: steps that include earning less income and going delinquent on mortgage payments.

There is always a small group of economists who dismiss the importance of incentives like these, and think that the vast majority of people are not really paying attention. I find their attitude to be arrogant, but -- more important -- contrary to the evidence. Bloomberg reports that 1 in 10 homeowners are in foreclosure or delinquent on their mortgage payments. Sure, some of them lost their jobs for reasons beyond their control (employment is down 1.4 from its peak). But not TEN PERCENT! The vast majority of those delinquent or in foreclosure continue to be employed.

The more important factor behind delinquent mortgage payments is that homeowners can get away with it. Yes, they risk losing their house. But a number of people find that preferable to overpaying for the house. They assume, and rightly so, that they can find another house, and find one cheaply.

Friday, December 5, 2008

Fundamental Origins of the Housing Boom and Bust


Professor Larry White says it was pro-housing regulatory and lending policy. Professor William Black said that Corporate CEO's had bad incentives.

I say that it might have been the anticipation of technological or taste change that did not materialize as quickly as we thought. I don't think the high and rising housing prices, and the fairly stable housing rental rates, are consistent with either Professor White's or Professor Black's theory.

We'll see what Professor DeLong has to say.

By the weekend, you will be able to read all four essays here.

Thursday, December 4, 2008

Bernanke is Unwittingly Damaging the Labor Market

Federal Reserve chairman Bernanke wants banks to reduce homeowners' mortgage payments, but do so as a function of homeowner income. I have already explained that this gives homeowners no incentive to earn income. If widespread enough, this forgiveness policy can turn a recession into a depression.

Two weeks I warned about this on my blog and in an NBER working paper.

I am not surprised that Bernanke does not read this blog. I can also understand why he makes this mistake -- his academic work was about how loan overhangs prevented new loans from getting made. But he misses that, even if new loan markets were functioning well, the old loans themselves do damage because they encourage people to try to become forgiveable. If he wants debts forgiven, they should be forgiven without regard for borrower circumstances.

Wednesday, December 3, 2008

Crowding Out -- Isn't it Obvious?

COMPETING THEORIES
Some economists promote the fantasy that an "exogenous" increase in spending in one receiving sector can increase spending in the other sectors. Supposedly the employees in the receiving sector take their paychecks to spend in other sectors.

By the same logic, an "exogenous" reduction in spending in one receiving sector can reduce spending in the other sectors.

This is a fantasy because it neglects supply. If supply is a constraint on output -- that is, to get more output additional employees and capital have to be encouraged to produce more -- then added spending in the receiving sector pulls resources out of the other sectors.

One application of this logic is to the public sector: the debate is whether public spending would increase or decrease private spending.

TESTING THE THEORY WITH DATA FROM 2008
Another application of this logic is to the residential sector: does residential spending increase or decrease nonresidential spending? Here it is easy to see the importance of supply -- see the figure below.

When housing boomed, nonresidential construction spending fell (despite the fact that the housing boom was increasing the prices of construction labor and materials) -- almost dollar for dollar!


When housing crashed, nonresidential construction spending ROSE (despite the fact that the housing crash was reducing the prices of construction labor and materials), about 15 cents on the dollar. Note that, according to the NBER, some of the nonresidential increase occur ed during a recession.

Another fascinating property of this episode is that the shocks to spending are on the order of magnitude (100s of billions of dollars) of the kinds of fiscal stimuli being recommended by some economists.

When interpreting what is above, we need to recognize that a large sector is omitted -- the non-construction sector. For this reason, the calculations above underestimate of the aggegate supply effect of housing spending on nonresidential spending (Take, for example, accountants. A housing boom pulls accountants into work for construction businesses, which leaves fewer accountants to work for non-construction businesses.). But they also underestimate the aggregate demand effect, because the housing construction workers are taking their paychecks and spending some of it on non-construction items. In any case, the supply effect is easy to see -- the housing construction boom did not take place with resources that would have otherwise been unemployed and the housing bust did not release resources entirely into unemployment.

Interestingly, this single graph both helps the case for crowding out and helps the case FOR Obama's fiscal stimulus. More on that paradox to come...

Tuesday, December 2, 2008

Depression Deception

The AFP reports that Federal Reserve Chairman Bernanke says that today's situation is "no comparison" to the Great Depression. I agree that there are many fundamental differences.

However, earlier President Bush was told by Bernanke (and Paulson) "if we don't act boldly, Mr. President, we could be in a depression greater than the Great Depression." I am not surprised that persons in the finance industry used scare tactics to increase their power and subsidy rate. I am surprised that they admitted it, and the admissions came so quickly.

Monday, December 1, 2008

Public Spending will Crowd Out Private Spending

The concern right now is that the private sector is shrinking, or at least not growing like it used to. My added concern has been that the new Administration would sell a "fiscal stimulus" based on the fantasy that government spending actually stimulates private spending (perhaps along the lines that Professor Krugman is selling the fiscal stimulus), when in fact public spending crowds out private spending.

I have been relieved to see that new Keynesians like Professor Mankiw are candid about the possibility that public spending reduces private spending.

I will write more as inauguration day approaches, but to a first order approximation, I think that public infrastructure spending may be a good idea, or at least not such a bad idea, even though it wouldn't stimulate the private sector.